Hmong vs Immigrants from Belarus Vision Disability
COMPARE
Hmong
Immigrants from Belarus
Vision Disability
Vision Disability Comparison
Hmong
Immigrants from Belarus
2.3%
VISION DISABILITY
2.5/ 100
METRIC RATING
228th/ 347
METRIC RANK
2.0%
VISION DISABILITY
99.3/ 100
METRIC RATING
53rd/ 347
METRIC RANK
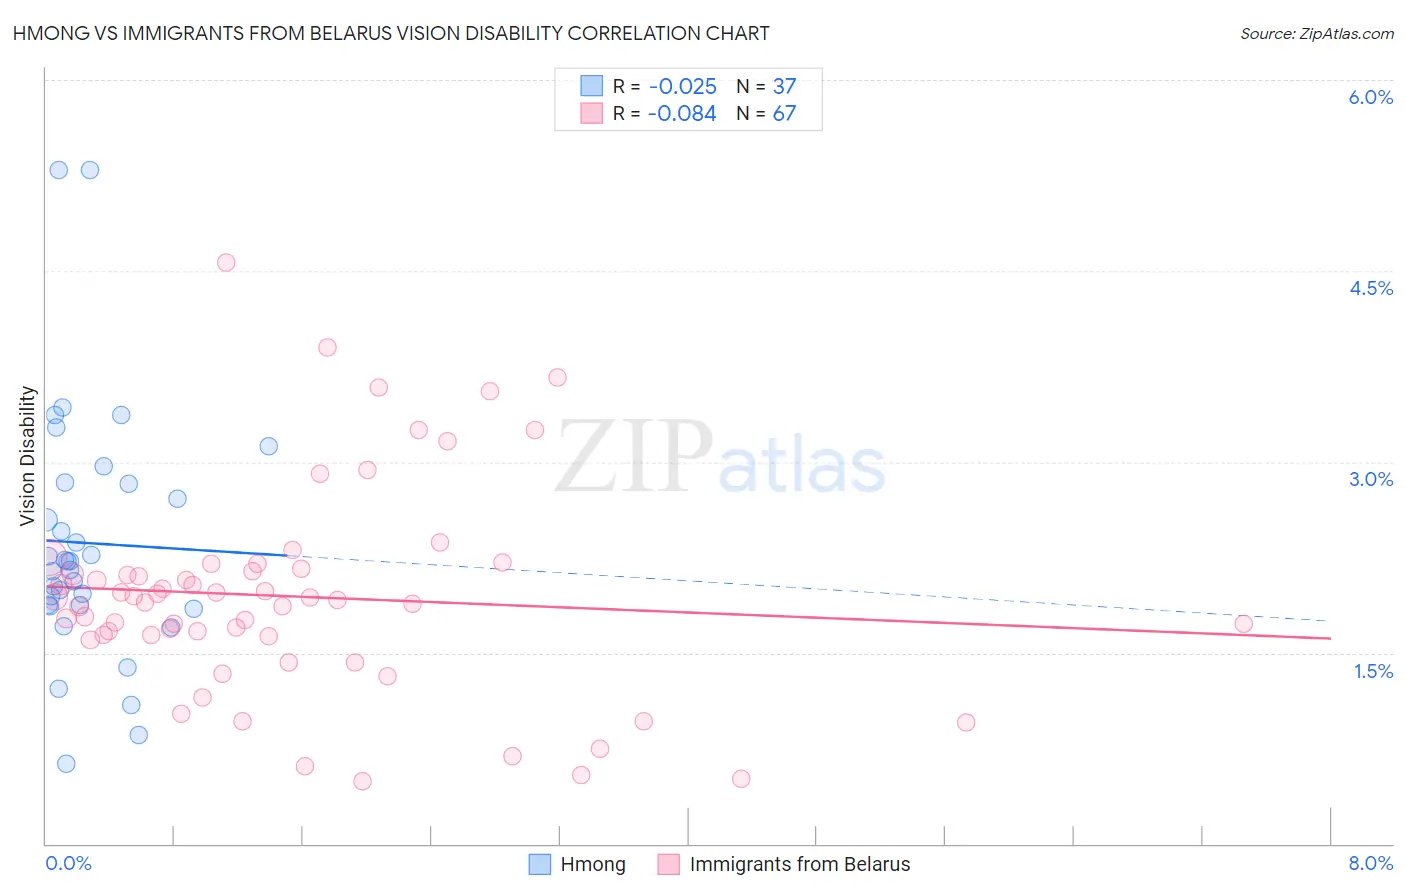
Hmong vs Immigrants from Belarus Vision Disability Correlation Chart
The statistical analysis conducted on geographies consisting of 24,669,236 people shows no correlation between the proportion of Hmong and percentage of population with vision disability in the United States with a correlation coefficient (R) of -0.025 and weighted average of 2.3%. Similarly, the statistical analysis conducted on geographies consisting of 150,159,443 people shows a slight negative correlation between the proportion of Immigrants from Belarus and percentage of population with vision disability in the United States with a correlation coefficient (R) of -0.084 and weighted average of 2.0%, a difference of 14.9%.
Vision Disability Correlation Summary
| Measurement | Hmong | Immigrants from Belarus |
| Minimum | 0.63% | 0.50% |
| Maximum | 5.3% | 4.6% |
| Range | 4.7% | 4.1% |
| Mean | 2.4% | 1.9% |
| Median | 2.2% | 1.9% |
| Interquartile 25% (IQ1) | 1.9% | 1.6% |
| Interquartile 75% (IQ3) | 2.8% | 2.2% |
| Interquartile Range (IQR) | 0.96% | 0.52% |
| Standard Deviation (Sample) | 0.98% | 0.82% |
| Standard Deviation (Population) | 0.97% | 0.81% |
Similar Demographics by Vision Disability
Demographics Similar to Hmong by Vision Disability
In terms of vision disability, the demographic groups most similar to Hmong are Welsh (2.3%, a difference of 0.080%), Nicaraguan (2.3%, a difference of 0.15%), Hawaiian (2.3%, a difference of 0.24%), Immigrants from Germany (2.3%, a difference of 0.29%), and Immigrants from Ecuador (2.3%, a difference of 0.31%).
| Demographics | Rating | Rank | Vision Disability |
| French Canadians | 3.9 /100 | #221 | Tragic 2.3% |
| Immigrants | Senegal | 3.8 /100 | #222 | Tragic 2.3% |
| Basques | 3.5 /100 | #223 | Tragic 2.3% |
| Irish | 3.4 /100 | #224 | Tragic 2.3% |
| Immigrants | Western Africa | 3.4 /100 | #225 | Tragic 2.3% |
| Immigrants | Germany | 3.0 /100 | #226 | Tragic 2.3% |
| Hawaiians | 2.9 /100 | #227 | Tragic 2.3% |
| Hmong | 2.5 /100 | #228 | Tragic 2.3% |
| Welsh | 2.3 /100 | #229 | Tragic 2.3% |
| Nicaraguans | 2.2 /100 | #230 | Tragic 2.3% |
| Immigrants | Ecuador | 2.0 /100 | #231 | Tragic 2.3% |
| German Russians | 1.8 /100 | #232 | Tragic 2.3% |
| Central Americans | 1.8 /100 | #233 | Tragic 2.3% |
| Scottish | 1.6 /100 | #234 | Tragic 2.3% |
| Marshallese | 1.5 /100 | #235 | Tragic 2.3% |
Demographics Similar to Immigrants from Belarus by Vision Disability
In terms of vision disability, the demographic groups most similar to Immigrants from Belarus are Macedonian (2.0%, a difference of 0.040%), Laotian (2.0%, a difference of 0.090%), Immigrants from Serbia (2.0%, a difference of 0.11%), Jordanian (2.0%, a difference of 0.26%), and Somali (2.0%, a difference of 0.28%).
| Demographics | Rating | Rank | Vision Disability |
| Immigrants | Sweden | 99.7 /100 | #46 | Exceptional 2.0% |
| Immigrants | Bulgaria | 99.7 /100 | #47 | Exceptional 2.0% |
| Israelis | 99.6 /100 | #48 | Exceptional 2.0% |
| Latvians | 99.5 /100 | #49 | Exceptional 2.0% |
| Afghans | 99.5 /100 | #50 | Exceptional 2.0% |
| Tongans | 99.5 /100 | #51 | Exceptional 2.0% |
| Immigrants | Serbia | 99.4 /100 | #52 | Exceptional 2.0% |
| Immigrants | Belarus | 99.3 /100 | #53 | Exceptional 2.0% |
| Macedonians | 99.3 /100 | #54 | Exceptional 2.0% |
| Laotians | 99.3 /100 | #55 | Exceptional 2.0% |
| Jordanians | 99.2 /100 | #56 | Exceptional 2.0% |
| Somalis | 99.2 /100 | #57 | Exceptional 2.0% |
| Immigrants | Saudi Arabia | 99.2 /100 | #58 | Exceptional 2.0% |
| Argentineans | 99.1 /100 | #59 | Exceptional 2.0% |
| Immigrants | Romania | 99.1 /100 | #60 | Exceptional 2.0% |