Immigrants from Guyana vs Immigrants from Belarus Female Poverty
COMPARE
Immigrants from Guyana
Immigrants from Belarus
Female Poverty
Female Poverty Comparison
Immigrants from Guyana
Immigrants from Belarus
15.6%
FEMALE POVERTY
0.1/ 100
METRIC RATING
260th/ 347
METRIC RANK
12.8%
FEMALE POVERTY
88.2/ 100
METRIC RATING
128th/ 347
METRIC RANK
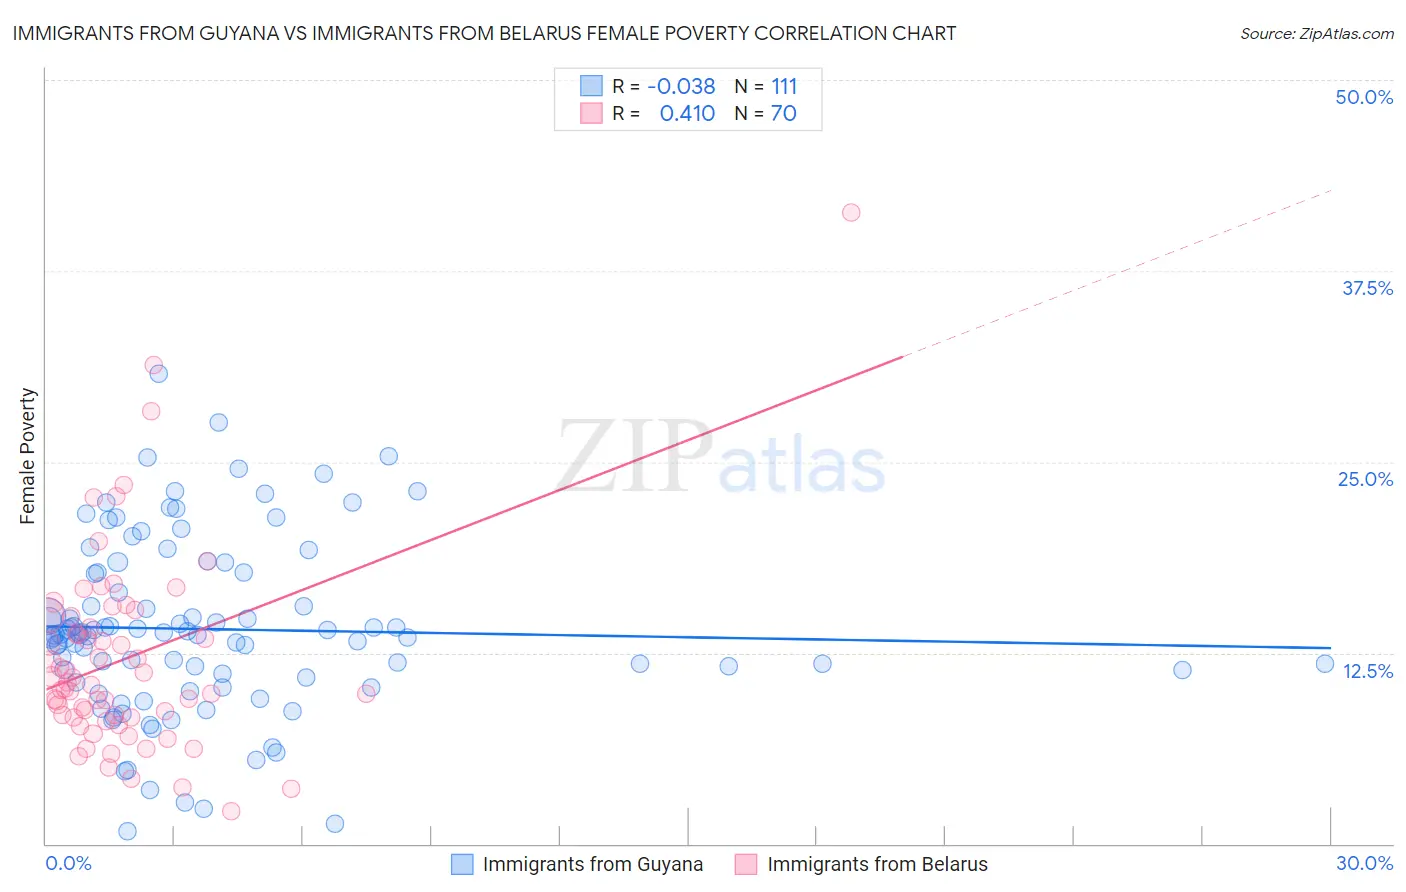
Immigrants from Guyana vs Immigrants from Belarus Female Poverty Correlation Chart
The statistical analysis conducted on geographies consisting of 183,633,406 people shows no correlation between the proportion of Immigrants from Guyana and poverty level among females in the United States with a correlation coefficient (R) of -0.038 and weighted average of 15.6%. Similarly, the statistical analysis conducted on geographies consisting of 150,175,369 people shows a moderate positive correlation between the proportion of Immigrants from Belarus and poverty level among females in the United States with a correlation coefficient (R) of 0.410 and weighted average of 12.8%, a difference of 21.9%.
Female Poverty Correlation Summary
| Measurement | Immigrants from Guyana | Immigrants from Belarus |
| Minimum | 0.82% | 2.1% |
| Maximum | 30.8% | 41.3% |
| Range | 30.0% | 39.2% |
| Mean | 14.1% | 12.1% |
| Median | 13.7% | 10.5% |
| Interquartile 25% (IQ1) | 10.9% | 8.3% |
| Interquartile 75% (IQ3) | 17.7% | 14.9% |
| Interquartile Range (IQR) | 6.8% | 6.6% |
| Standard Deviation (Sample) | 5.7% | 6.5% |
| Standard Deviation (Population) | 5.7% | 6.5% |
Similar Demographics by Female Poverty
Demographics Similar to Immigrants from Guyana by Female Poverty
In terms of female poverty, the demographic groups most similar to Immigrants from Guyana are Cape Verdean (15.6%, a difference of 0.080%), Guyanese (15.6%, a difference of 0.10%), Mexican American Indian (15.6%, a difference of 0.10%), Cherokee (15.6%, a difference of 0.11%), and Shoshone (15.6%, a difference of 0.19%).
| Demographics | Rating | Rank | Female Poverty |
| Liberians | 0.2 /100 | #253 | Tragic 15.4% |
| Trinidadians and Tobagonians | 0.2 /100 | #254 | Tragic 15.4% |
| Ottawa | 0.2 /100 | #255 | Tragic 15.5% |
| Jamaicans | 0.2 /100 | #256 | Tragic 15.5% |
| Immigrants | Jamaica | 0.1 /100 | #257 | Tragic 15.6% |
| Shoshone | 0.1 /100 | #258 | Tragic 15.6% |
| Cape Verdeans | 0.1 /100 | #259 | Tragic 15.6% |
| Immigrants | Guyana | 0.1 /100 | #260 | Tragic 15.6% |
| Guyanese | 0.1 /100 | #261 | Tragic 15.6% |
| Mexican American Indians | 0.1 /100 | #262 | Tragic 15.6% |
| Cherokee | 0.1 /100 | #263 | Tragic 15.6% |
| Immigrants | Ecuador | 0.1 /100 | #264 | Tragic 15.6% |
| Immigrants | Liberia | 0.1 /100 | #265 | Tragic 15.7% |
| Immigrants | El Salvador | 0.1 /100 | #266 | Tragic 15.7% |
| Sub-Saharan Africans | 0.1 /100 | #267 | Tragic 15.8% |
Demographics Similar to Immigrants from Belarus by Female Poverty
In terms of female poverty, the demographic groups most similar to Immigrants from Belarus are South African (12.8%, a difference of 0.040%), Immigrants from Brazil (12.8%, a difference of 0.070%), Immigrants from Ukraine (12.8%, a difference of 0.14%), Argentinean (12.8%, a difference of 0.22%), and Immigrants from Norway (12.8%, a difference of 0.27%).
| Demographics | Rating | Rank | Female Poverty |
| Immigrants | Hungary | 90.3 /100 | #121 | Exceptional 12.7% |
| French Canadians | 90.2 /100 | #122 | Exceptional 12.7% |
| Immigrants | South Eastern Asia | 89.9 /100 | #123 | Excellent 12.7% |
| Immigrants | Norway | 89.3 /100 | #124 | Excellent 12.8% |
| Argentineans | 89.1 /100 | #125 | Excellent 12.8% |
| Immigrants | Ukraine | 88.8 /100 | #126 | Excellent 12.8% |
| South Africans | 88.4 /100 | #127 | Excellent 12.8% |
| Immigrants | Belarus | 88.2 /100 | #128 | Excellent 12.8% |
| Immigrants | Brazil | 87.9 /100 | #129 | Excellent 12.8% |
| Immigrants | Vietnam | 87.1 /100 | #130 | Excellent 12.8% |
| Immigrants | Argentina | 87.0 /100 | #131 | Excellent 12.8% |
| Immigrants | Jordan | 86.9 /100 | #132 | Excellent 12.8% |
| Immigrants | Western Europe | 86.6 /100 | #133 | Excellent 12.8% |
| Immigrants | Switzerland | 85.8 /100 | #134 | Excellent 12.9% |
| French | 85.6 /100 | #135 | Excellent 12.9% |