Haitian vs Immigrants from Eastern Europe Per Capita Income
COMPARE
Haitian
Immigrants from Eastern Europe
Per Capita Income
Per Capita Income Comparison
Haitians
Immigrants from Eastern Europe
$37,289
PER CAPITA INCOME
0.1/ 100
METRIC RATING
297th/ 347
METRIC RANK
$49,316
PER CAPITA INCOME
99.8/ 100
METRIC RATING
70th/ 347
METRIC RANK
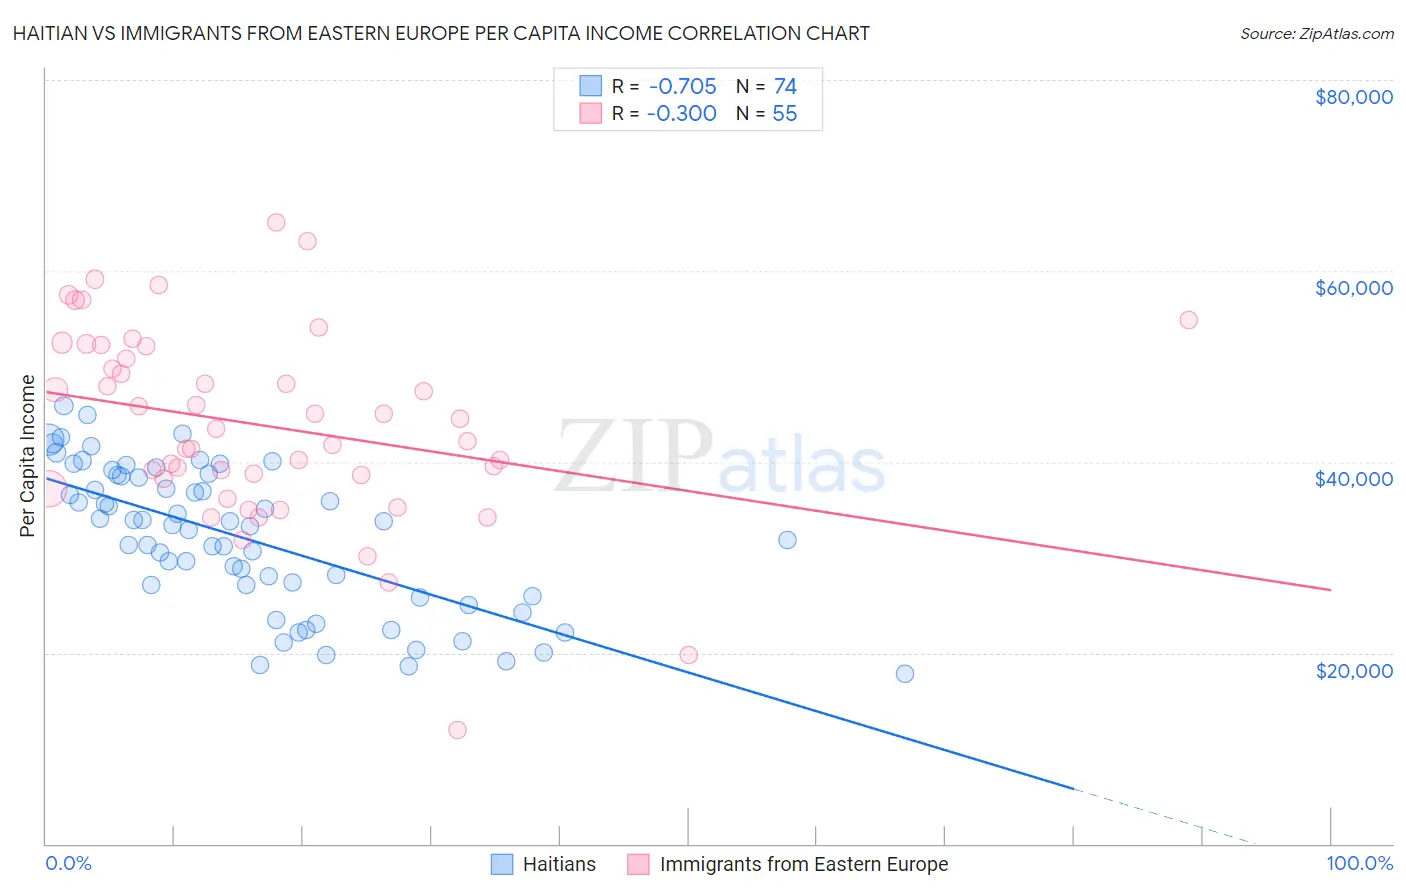
Haitian vs Immigrants from Eastern Europe Per Capita Income Correlation Chart
The statistical analysis conducted on geographies consisting of 288,031,086 people shows a strong negative correlation between the proportion of Haitians and per capita income in the United States with a correlation coefficient (R) of -0.705 and weighted average of $37,289. Similarly, the statistical analysis conducted on geographies consisting of 475,909,119 people shows a mild negative correlation between the proportion of Immigrants from Eastern Europe and per capita income in the United States with a correlation coefficient (R) of -0.300 and weighted average of $49,316, a difference of 32.3%.
Per Capita Income Correlation Summary
| Measurement | Haitian | Immigrants from Eastern Europe |
| Minimum | $17,858 | $11,876 |
| Maximum | $45,871 | $65,115 |
| Range | $28,013 | $53,239 |
| Mean | $31,987 | $43,803 |
| Median | $33,320 | $43,497 |
| Interquartile 25% (IQ1) | $25,885 | $38,232 |
| Interquartile 75% (IQ3) | $38,541 | $52,105 |
| Interquartile Range (IQR) | $12,656 | $13,872 |
| Standard Deviation (Sample) | $7,480 | $10,236 |
| Standard Deviation (Population) | $7,429 | $10,143 |
Similar Demographics by Per Capita Income
Demographics Similar to Haitians by Per Capita Income
In terms of per capita income, the demographic groups most similar to Haitians are Indonesian ($37,300, a difference of 0.030%), Immigrants from Dominican Republic ($37,306, a difference of 0.040%), Immigrants from Caribbean ($37,254, a difference of 0.090%), Cherokee ($37,203, a difference of 0.23%), and Cuban ($37,383, a difference of 0.25%).
| Demographics | Rating | Rank | Per Capita Income |
| Immigrants | Guatemala | 0.1 /100 | #290 | Tragic $37,550 |
| Cajuns | 0.1 /100 | #291 | Tragic $37,527 |
| Immigrants | Micronesia | 0.1 /100 | #292 | Tragic $37,464 |
| Mexican American Indians | 0.1 /100 | #293 | Tragic $37,407 |
| Cubans | 0.1 /100 | #294 | Tragic $37,383 |
| Immigrants | Dominican Republic | 0.1 /100 | #295 | Tragic $37,306 |
| Indonesians | 0.1 /100 | #296 | Tragic $37,300 |
| Haitians | 0.1 /100 | #297 | Tragic $37,289 |
| Immigrants | Caribbean | 0.1 /100 | #298 | Tragic $37,254 |
| Cherokee | 0.1 /100 | #299 | Tragic $37,203 |
| Immigrants | Bahamas | 0.1 /100 | #300 | Tragic $37,193 |
| Ottawa | 0.1 /100 | #301 | Tragic $37,101 |
| Shoshone | 0.1 /100 | #302 | Tragic $37,072 |
| Paiute | 0.1 /100 | #303 | Tragic $37,066 |
| Hondurans | 0.1 /100 | #304 | Tragic $37,031 |
Demographics Similar to Immigrants from Eastern Europe by Per Capita Income
In terms of per capita income, the demographic groups most similar to Immigrants from Eastern Europe are Greek ($49,309, a difference of 0.010%), Immigrants from Hungary ($49,303, a difference of 0.030%), Immigrants from North America ($49,302, a difference of 0.030%), Immigrants from Canada ($49,412, a difference of 0.20%), and Lithuanian ($49,448, a difference of 0.27%).
| Demographics | Rating | Rank | Per Capita Income |
| Maltese | 99.9 /100 | #63 | Exceptional $49,640 |
| Immigrants | Argentina | 99.9 /100 | #64 | Exceptional $49,627 |
| Bolivians | 99.9 /100 | #65 | Exceptional $49,526 |
| Immigrants | Bulgaria | 99.9 /100 | #66 | Exceptional $49,482 |
| Immigrants | Romania | 99.9 /100 | #67 | Exceptional $49,463 |
| Lithuanians | 99.8 /100 | #68 | Exceptional $49,448 |
| Immigrants | Canada | 99.8 /100 | #69 | Exceptional $49,412 |
| Immigrants | Eastern Europe | 99.8 /100 | #70 | Exceptional $49,316 |
| Greeks | 99.8 /100 | #71 | Exceptional $49,309 |
| Immigrants | Hungary | 99.8 /100 | #72 | Exceptional $49,303 |
| Immigrants | North America | 99.8 /100 | #73 | Exceptional $49,302 |
| Mongolians | 99.8 /100 | #74 | Exceptional $49,173 |
| Immigrants | Bolivia | 99.7 /100 | #75 | Exceptional $48,970 |
| Immigrants | England | 99.7 /100 | #76 | Exceptional $48,844 |
| Immigrants | Kazakhstan | 99.7 /100 | #77 | Exceptional $48,747 |