Malaysian vs Immigrants from Sudan Single Male Poverty
COMPARE
Malaysian
Immigrants from Sudan
Single Male Poverty
Single Male Poverty Comparison
Malaysians
Immigrants from Sudan
12.6%
SINGLE MALE POVERTY
74.8/ 100
METRIC RATING
147th/ 347
METRIC RANK
12.7%
SINGLE MALE POVERTY
58.2/ 100
METRIC RATING
167th/ 347
METRIC RANK
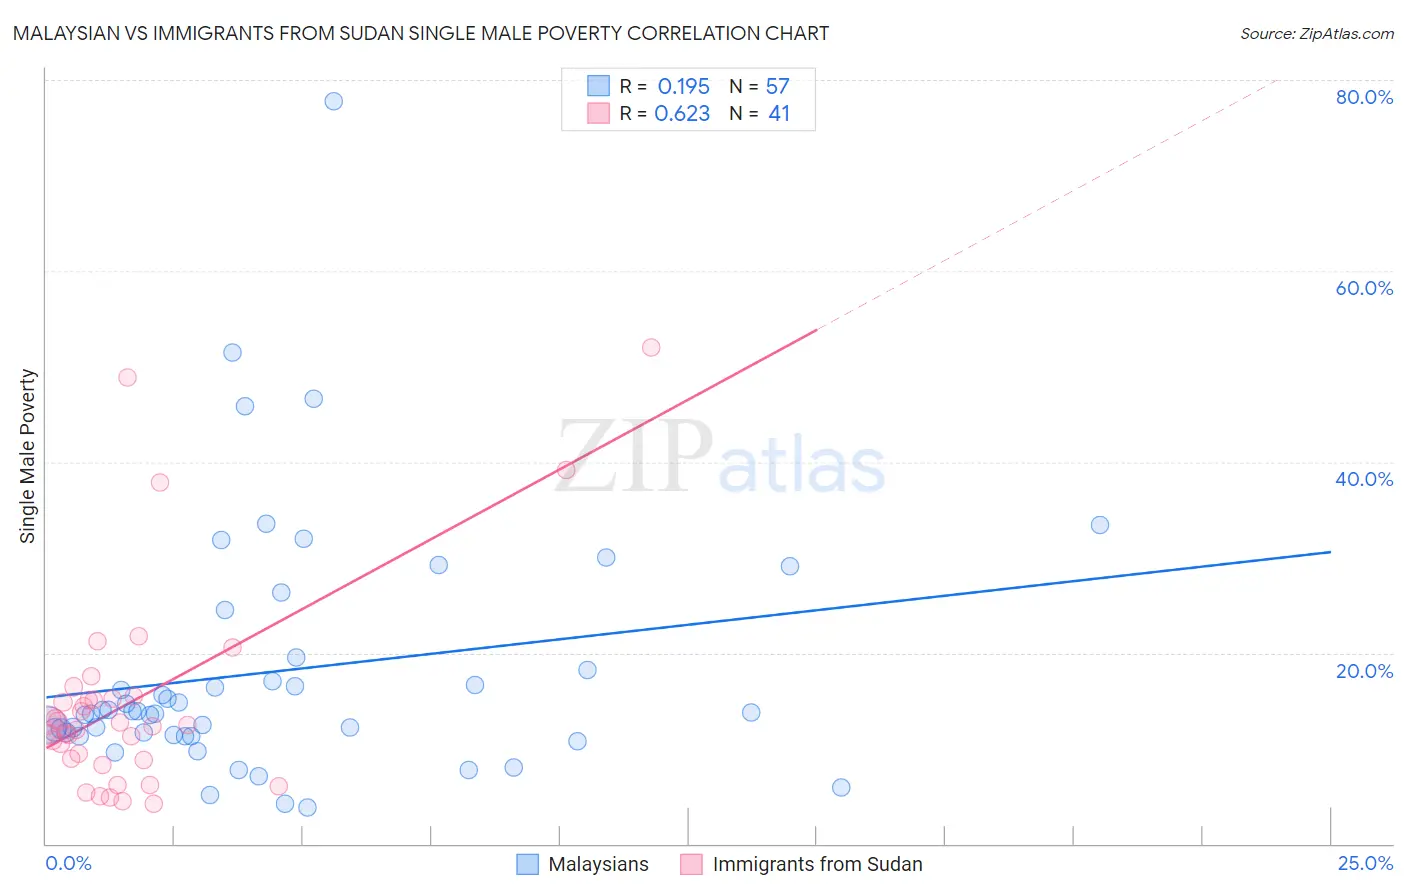
Malaysian vs Immigrants from Sudan Single Male Poverty Correlation Chart
The statistical analysis conducted on geographies consisting of 211,653,491 people shows a poor positive correlation between the proportion of Malaysians and poverty level among single males in the United States with a correlation coefficient (R) of 0.195 and weighted average of 12.6%. Similarly, the statistical analysis conducted on geographies consisting of 114,680,115 people shows a significant positive correlation between the proportion of Immigrants from Sudan and poverty level among single males in the United States with a correlation coefficient (R) of 0.623 and weighted average of 12.7%, a difference of 1.0%.
Single Male Poverty Correlation Summary
| Measurement | Malaysian | Immigrants from Sudan |
| Minimum | 3.8% | 4.2% |
| Maximum | 77.8% | 52.0% |
| Range | 74.0% | 47.8% |
| Mean | 18.1% | 14.9% |
| Median | 13.8% | 12.5% |
| Interquartile 25% (IQ1) | 11.4% | 8.9% |
| Interquartile 75% (IQ3) | 18.8% | 15.4% |
| Interquartile Range (IQR) | 7.5% | 6.5% |
| Standard Deviation (Sample) | 13.2% | 10.9% |
| Standard Deviation (Population) | 13.0% | 10.8% |
Demographics Similar to Malaysians and Immigrants from Sudan by Single Male Poverty
In terms of single male poverty, the demographic groups most similar to Malaysians are Yugoslavian (12.6%, a difference of 0.060%), Sierra Leonean (12.6%, a difference of 0.12%), Immigrants from Panama (12.6%, a difference of 0.18%), Immigrants from Hungary (12.6%, a difference of 0.20%), and Australian (12.6%, a difference of 0.23%). Similarly, the demographic groups most similar to Immigrants from Sudan are Immigrants from Guyana (12.7%, a difference of 0.13%), Immigrants from Cambodia (12.7%, a difference of 0.22%), Immigrants from Nigeria (12.7%, a difference of 0.26%), Palestinian (12.7%, a difference of 0.27%), and Eastern European (12.7%, a difference of 0.28%).
| Demographics | Rating | Rank | Single Male Poverty |
| Malaysians | 74.8 /100 | #147 | Good 12.6% |
| Yugoslavians | 73.9 /100 | #148 | Good 12.6% |
| Sierra Leoneans | 73.0 /100 | #149 | Good 12.6% |
| Immigrants | Panama | 72.1 /100 | #150 | Good 12.6% |
| Immigrants | Hungary | 71.9 /100 | #151 | Good 12.6% |
| Australians | 71.4 /100 | #152 | Good 12.6% |
| Immigrants | Immigrants | 70.1 /100 | #153 | Good 12.7% |
| Immigrants | Scotland | 68.9 /100 | #154 | Good 12.7% |
| Immigrants | Spain | 68.7 /100 | #155 | Good 12.7% |
| Vietnamese | 67.9 /100 | #156 | Good 12.7% |
| Latvians | 67.9 /100 | #157 | Good 12.7% |
| Immigrants | Middle Africa | 64.9 /100 | #158 | Good 12.7% |
| Immigrants | Liberia | 64.2 /100 | #159 | Good 12.7% |
| Greeks | 64.1 /100 | #160 | Good 12.7% |
| Immigrants | Africa | 63.4 /100 | #161 | Good 12.7% |
| Eastern Europeans | 63.3 /100 | #162 | Good 12.7% |
| Palestinians | 63.1 /100 | #163 | Good 12.7% |
| Immigrants | Nigeria | 62.8 /100 | #164 | Good 12.7% |
| Immigrants | Cambodia | 62.2 /100 | #165 | Good 12.7% |
| Immigrants | Guyana | 60.5 /100 | #166 | Good 12.7% |
| Immigrants | Sudan | 58.2 /100 | #167 | Average 12.7% |