Guamanian/Chamorro vs Spanish Single Male Poverty
COMPARE
Guamanian/Chamorro
Spanish
Single Male Poverty
Single Male Poverty Comparison
Guamanians/Chamorros
Spanish
12.2%
SINGLE MALE POVERTY
97.4/ 100
METRIC RATING
98th/ 347
METRIC RANK
13.6%
SINGLE MALE POVERTY
1.0/ 100
METRIC RATING
249th/ 347
METRIC RANK
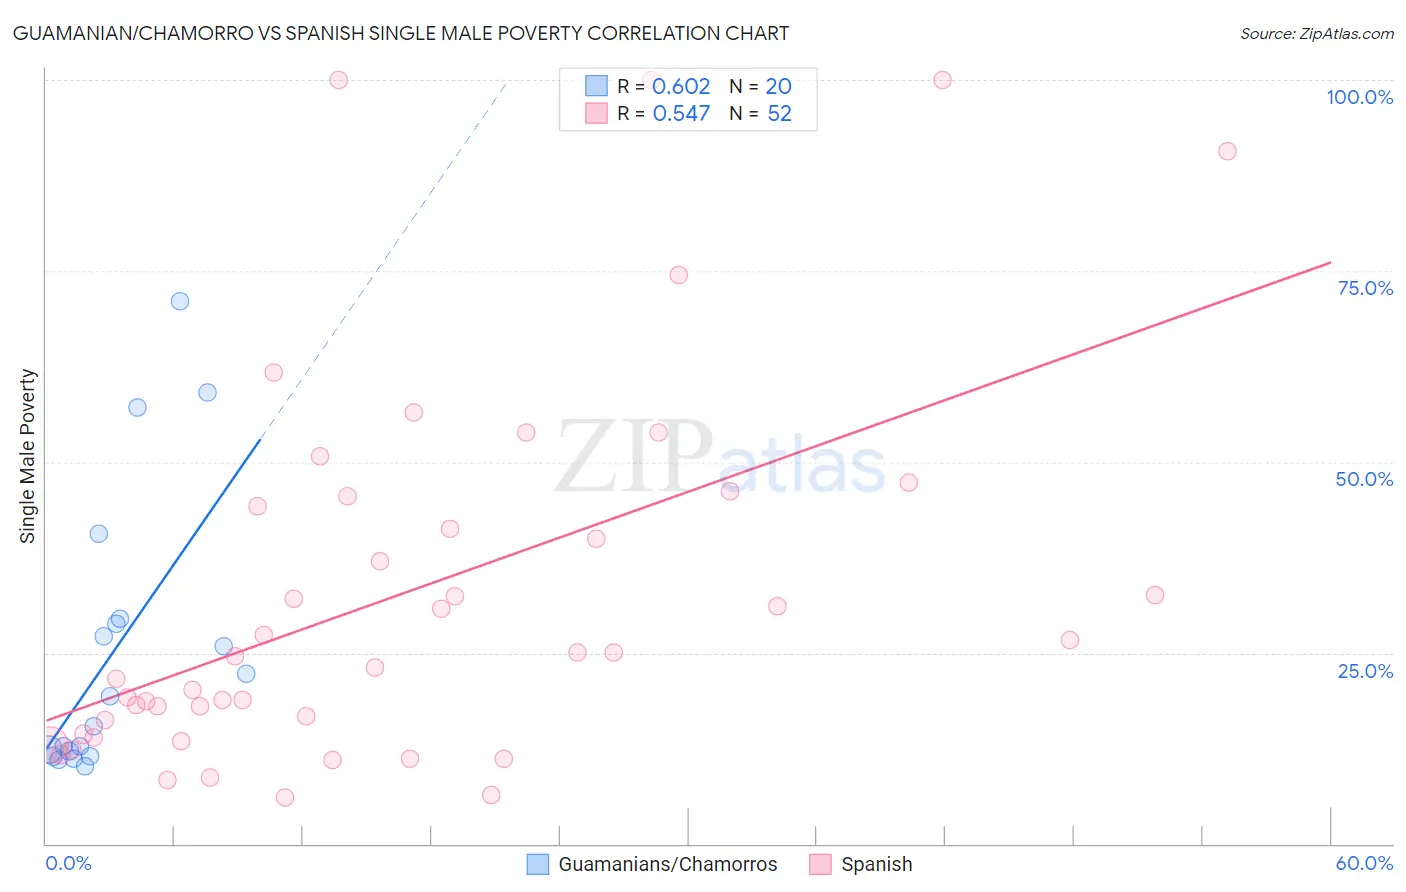
Guamanian/Chamorro vs Spanish Single Male Poverty Correlation Chart
The statistical analysis conducted on geographies consisting of 207,536,153 people shows a significant positive correlation between the proportion of Guamanians/Chamorros and poverty level among single males in the United States with a correlation coefficient (R) of 0.602 and weighted average of 12.2%. Similarly, the statistical analysis conducted on geographies consisting of 373,377,488 people shows a substantial positive correlation between the proportion of Spanish and poverty level among single males in the United States with a correlation coefficient (R) of 0.547 and weighted average of 13.6%, a difference of 11.4%.
Single Male Poverty Correlation Summary
| Measurement | Guamanian/Chamorro | Spanish |
| Minimum | 10.2% | 6.1% |
| Maximum | 71.1% | 100.0% |
| Range | 60.8% | 93.9% |
| Mean | 25.1% | 32.7% |
| Median | 17.3% | 24.8% |
| Interquartile 25% (IQ1) | 11.8% | 15.3% |
| Interquartile 75% (IQ3) | 29.1% | 44.8% |
| Interquartile Range (IQR) | 17.3% | 29.6% |
| Standard Deviation (Sample) | 18.3% | 24.7% |
| Standard Deviation (Population) | 17.8% | 24.4% |
Similar Demographics by Single Male Poverty
Demographics Similar to Guamanians/Chamorros by Single Male Poverty
In terms of single male poverty, the demographic groups most similar to Guamanians/Chamorros are Immigrants from Italy (12.2%, a difference of 0.0%), Immigrants from Cuba (12.2%, a difference of 0.040%), Immigrants from Sweden (12.2%, a difference of 0.050%), Immigrants from Australia (12.2%, a difference of 0.15%), and Immigrants from Latvia (12.2%, a difference of 0.19%).
| Demographics | Rating | Rank | Single Male Poverty |
| Immigrants | Turkey | 98.2 /100 | #91 | Exceptional 12.1% |
| Spanish American Indians | 98.0 /100 | #92 | Exceptional 12.1% |
| Immigrants | Bosnia and Herzegovina | 97.9 /100 | #93 | Exceptional 12.1% |
| Colombians | 97.8 /100 | #94 | Exceptional 12.2% |
| Mongolians | 97.7 /100 | #95 | Exceptional 12.2% |
| Immigrants | Sweden | 97.5 /100 | #96 | Exceptional 12.2% |
| Immigrants | Italy | 97.4 /100 | #97 | Exceptional 12.2% |
| Guamanians/Chamorros | 97.4 /100 | #98 | Exceptional 12.2% |
| Immigrants | Cuba | 97.3 /100 | #99 | Exceptional 12.2% |
| Immigrants | Australia | 97.1 /100 | #100 | Exceptional 12.2% |
| Immigrants | Latvia | 97.0 /100 | #101 | Exceptional 12.2% |
| Immigrants | Europe | 97.0 /100 | #102 | Exceptional 12.2% |
| Immigrants | Armenia | 96.7 /100 | #103 | Exceptional 12.2% |
| Immigrants | Kazakhstan | 96.7 /100 | #104 | Exceptional 12.2% |
| Jordanians | 95.9 /100 | #105 | Exceptional 12.3% |
Demographics Similar to Spanish by Single Male Poverty
In terms of single male poverty, the demographic groups most similar to Spanish are Immigrants from Somalia (13.6%, a difference of 0.020%), Immigrants from Zaire (13.6%, a difference of 0.13%), Finnish (13.6%, a difference of 0.17%), Czech (13.5%, a difference of 0.24%), and Belgian (13.5%, a difference of 0.27%).
| Demographics | Rating | Rank | Single Male Poverty |
| Carpatho Rusyns | 2.1 /100 | #242 | Tragic 13.4% |
| Barbadians | 2.1 /100 | #243 | Tragic 13.4% |
| Immigrants | Senegal | 1.7 /100 | #244 | Tragic 13.5% |
| Immigrants | Latin America | 1.3 /100 | #245 | Tragic 13.5% |
| Immigrants | Micronesia | 1.2 /100 | #246 | Tragic 13.5% |
| Belgians | 1.2 /100 | #247 | Tragic 13.5% |
| Czechs | 1.2 /100 | #248 | Tragic 13.5% |
| Spanish | 1.0 /100 | #249 | Tragic 13.6% |
| Immigrants | Somalia | 1.0 /100 | #250 | Tragic 13.6% |
| Immigrants | Zaire | 0.9 /100 | #251 | Tragic 13.6% |
| Finns | 0.9 /100 | #252 | Tragic 13.6% |
| German Russians | 0.8 /100 | #253 | Tragic 13.6% |
| Sub-Saharan Africans | 0.5 /100 | #254 | Tragic 13.7% |
| Spaniards | 0.4 /100 | #255 | Tragic 13.7% |
| Immigrants | Belize | 0.4 /100 | #256 | Tragic 13.7% |