African vs Immigrants from Sudan Single Male Poverty
COMPARE
African
Immigrants from Sudan
Single Male Poverty
Single Male Poverty Comparison
Africans
Immigrants from Sudan
14.7%
SINGLE MALE POVERTY
0.0/ 100
METRIC RATING
296th/ 347
METRIC RANK
12.7%
SINGLE MALE POVERTY
58.2/ 100
METRIC RATING
167th/ 347
METRIC RANK
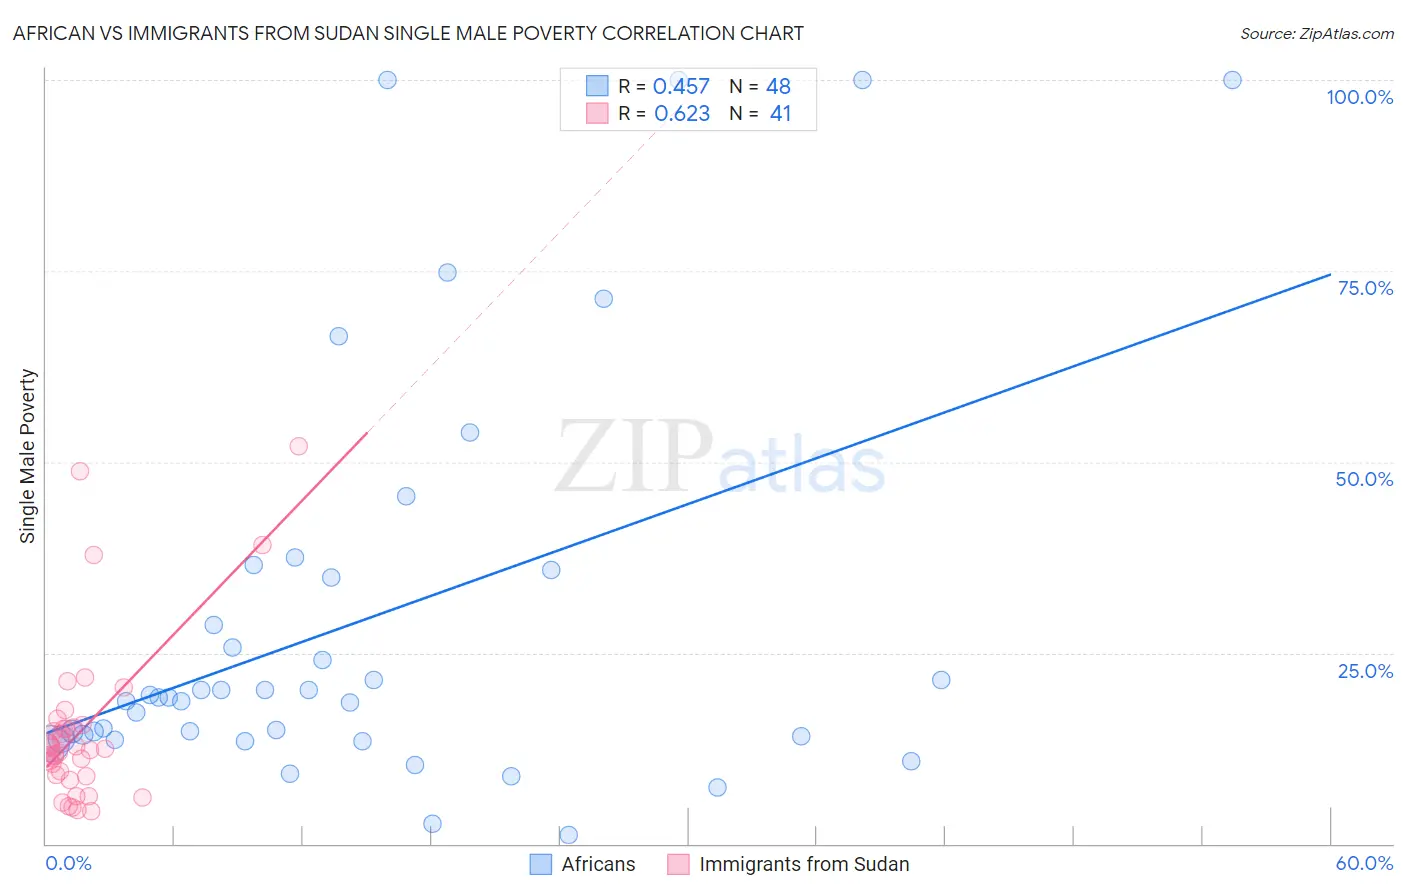
African vs Immigrants from Sudan Single Male Poverty Correlation Chart
The statistical analysis conducted on geographies consisting of 417,076,777 people shows a moderate positive correlation between the proportion of Africans and poverty level among single males in the United States with a correlation coefficient (R) of 0.457 and weighted average of 14.7%. Similarly, the statistical analysis conducted on geographies consisting of 114,680,115 people shows a significant positive correlation between the proportion of Immigrants from Sudan and poverty level among single males in the United States with a correlation coefficient (R) of 0.623 and weighted average of 12.7%, a difference of 15.6%.
Single Male Poverty Correlation Summary
| Measurement | African | Immigrants from Sudan |
| Minimum | 1.1% | 4.2% |
| Maximum | 100.0% | 52.0% |
| Range | 98.9% | 47.8% |
| Mean | 29.4% | 14.9% |
| Median | 19.1% | 12.5% |
| Interquartile 25% (IQ1) | 13.9% | 8.9% |
| Interquartile 75% (IQ3) | 35.4% | 15.4% |
| Interquartile Range (IQR) | 21.5% | 6.5% |
| Standard Deviation (Sample) | 26.8% | 10.9% |
| Standard Deviation (Population) | 26.6% | 10.8% |
Similar Demographics by Single Male Poverty
Demographics Similar to Africans by Single Male Poverty
In terms of single male poverty, the demographic groups most similar to Africans are Scotch-Irish (14.7%, a difference of 0.33%), Immigrants from Dominican Republic (14.8%, a difference of 0.35%), Ottawa (14.6%, a difference of 0.77%), French Canadian (14.6%, a difference of 0.95%), and Nonimmigrants (14.6%, a difference of 1.1%).
| Demographics | Rating | Rank | Single Male Poverty |
| Immigrants | Dominica | 0.0 /100 | #289 | Tragic 14.5% |
| U.S. Virgin Islanders | 0.0 /100 | #290 | Tragic 14.5% |
| Bahamians | 0.0 /100 | #291 | Tragic 14.6% |
| Immigrants | Nonimmigrants | 0.0 /100 | #292 | Tragic 14.6% |
| French Canadians | 0.0 /100 | #293 | Tragic 14.6% |
| Ottawa | 0.0 /100 | #294 | Tragic 14.6% |
| Scotch-Irish | 0.0 /100 | #295 | Tragic 14.7% |
| Africans | 0.0 /100 | #296 | Tragic 14.7% |
| Immigrants | Dominican Republic | 0.0 /100 | #297 | Tragic 14.8% |
| French American Indians | 0.0 /100 | #298 | Tragic 15.0% |
| Delaware | 0.0 /100 | #299 | Tragic 15.0% |
| Cree | 0.0 /100 | #300 | Tragic 15.1% |
| Dominicans | 0.0 /100 | #301 | Tragic 15.2% |
| Alsatians | 0.0 /100 | #302 | Tragic 15.2% |
| Aleuts | 0.0 /100 | #303 | Tragic 15.4% |
Demographics Similar to Immigrants from Sudan by Single Male Poverty
In terms of single male poverty, the demographic groups most similar to Immigrants from Sudan are Immigrants from Barbados (12.7%, a difference of 0.030%), Immigrants from Guyana (12.7%, a difference of 0.13%), Puget Sound Salish (12.8%, a difference of 0.21%), Immigrants from Cambodia (12.7%, a difference of 0.22%), and Immigrants from Nigeria (12.7%, a difference of 0.26%).
| Demographics | Rating | Rank | Single Male Poverty |
| Greeks | 64.1 /100 | #160 | Good 12.7% |
| Immigrants | Africa | 63.4 /100 | #161 | Good 12.7% |
| Eastern Europeans | 63.3 /100 | #162 | Good 12.7% |
| Palestinians | 63.1 /100 | #163 | Good 12.7% |
| Immigrants | Nigeria | 62.8 /100 | #164 | Good 12.7% |
| Immigrants | Cambodia | 62.2 /100 | #165 | Good 12.7% |
| Immigrants | Guyana | 60.5 /100 | #166 | Good 12.7% |
| Immigrants | Sudan | 58.2 /100 | #167 | Average 12.7% |
| Immigrants | Barbados | 57.7 /100 | #168 | Average 12.7% |
| Puget Sound Salish | 54.3 /100 | #169 | Average 12.8% |
| Guyanese | 52.0 /100 | #170 | Average 12.8% |
| South Africans | 51.5 /100 | #171 | Average 12.8% |
| Danes | 51.4 /100 | #172 | Average 12.8% |
| Immigrants | St. Vincent and the Grenadines | 50.9 /100 | #173 | Average 12.8% |
| Costa Ricans | 50.0 /100 | #174 | Average 12.8% |