Guamanian/Chamorro vs Immigrants from Saudi Arabia Single Male Poverty
COMPARE
Guamanian/Chamorro
Immigrants from Saudi Arabia
Single Male Poverty
Single Male Poverty Comparison
Guamanians/Chamorros
Immigrants from Saudi Arabia
12.2%
SINGLE MALE POVERTY
97.4/ 100
METRIC RATING
98th/ 347
METRIC RANK
14.0%
SINGLE MALE POVERTY
0.1/ 100
METRIC RATING
270th/ 347
METRIC RANK
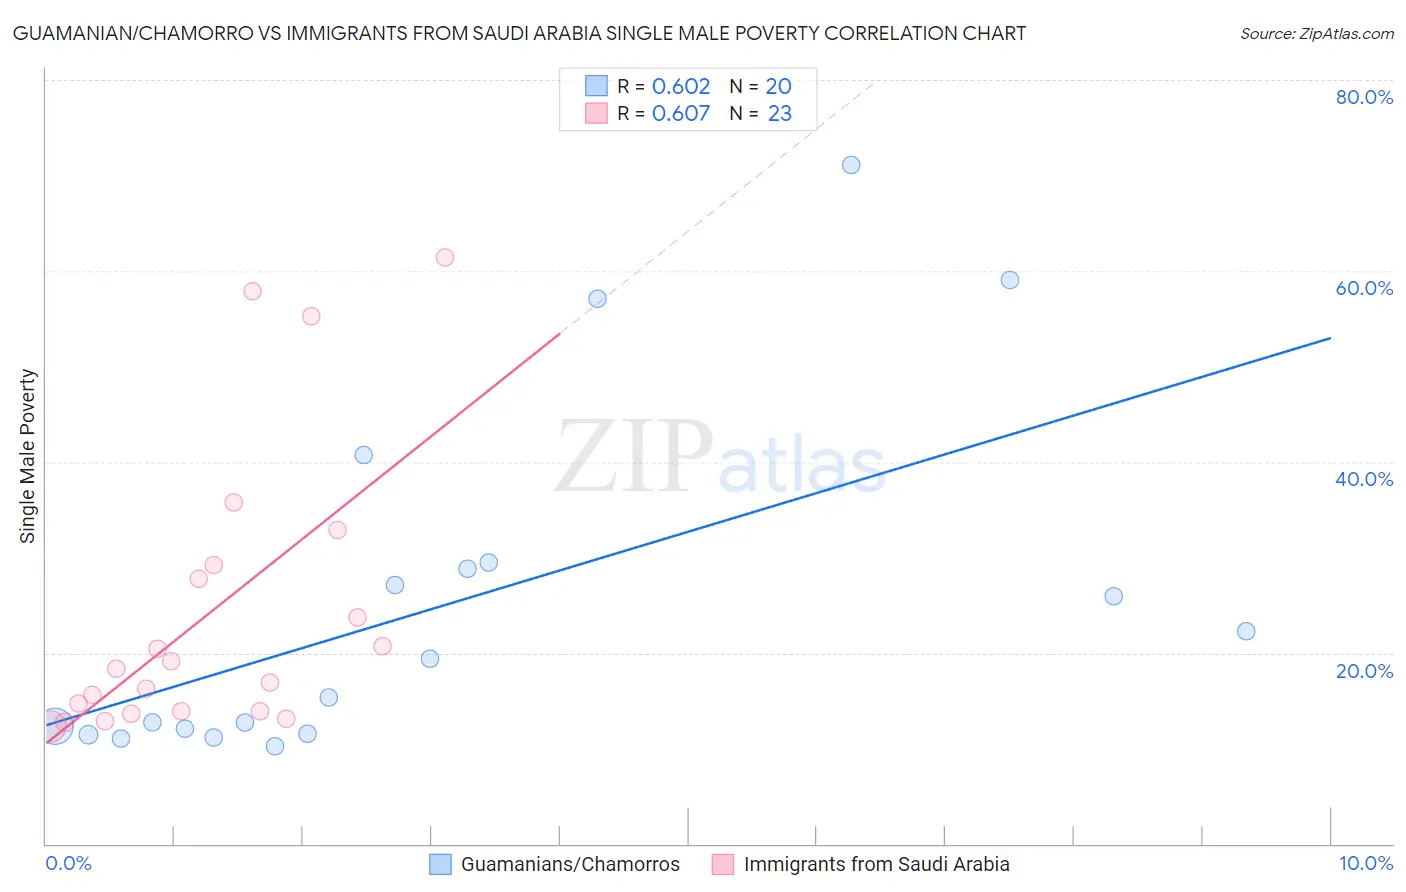
Guamanian/Chamorro vs Immigrants from Saudi Arabia Single Male Poverty Correlation Chart
The statistical analysis conducted on geographies consisting of 207,536,153 people shows a significant positive correlation between the proportion of Guamanians/Chamorros and poverty level among single males in the United States with a correlation coefficient (R) of 0.602 and weighted average of 12.2%. Similarly, the statistical analysis conducted on geographies consisting of 155,832,907 people shows a significant positive correlation between the proportion of Immigrants from Saudi Arabia and poverty level among single males in the United States with a correlation coefficient (R) of 0.607 and weighted average of 14.0%, a difference of 14.6%.
Single Male Poverty Correlation Summary
| Measurement | Guamanian/Chamorro | Immigrants from Saudi Arabia |
| Minimum | 10.2% | 12.2% |
| Maximum | 71.1% | 61.3% |
| Range | 60.8% | 49.1% |
| Mean | 25.1% | 24.3% |
| Median | 17.3% | 18.3% |
| Interquartile 25% (IQ1) | 11.8% | 13.9% |
| Interquartile 75% (IQ3) | 29.1% | 29.1% |
| Interquartile Range (IQR) | 17.3% | 15.3% |
| Standard Deviation (Sample) | 18.3% | 15.0% |
| Standard Deviation (Population) | 17.8% | 14.7% |
Similar Demographics by Single Male Poverty
Demographics Similar to Guamanians/Chamorros by Single Male Poverty
In terms of single male poverty, the demographic groups most similar to Guamanians/Chamorros are Immigrants from Italy (12.2%, a difference of 0.0%), Immigrants from Cuba (12.2%, a difference of 0.040%), Immigrants from Sweden (12.2%, a difference of 0.050%), Immigrants from Australia (12.2%, a difference of 0.15%), and Immigrants from Latvia (12.2%, a difference of 0.19%).
| Demographics | Rating | Rank | Single Male Poverty |
| Immigrants | Turkey | 98.2 /100 | #91 | Exceptional 12.1% |
| Spanish American Indians | 98.0 /100 | #92 | Exceptional 12.1% |
| Immigrants | Bosnia and Herzegovina | 97.9 /100 | #93 | Exceptional 12.1% |
| Colombians | 97.8 /100 | #94 | Exceptional 12.2% |
| Mongolians | 97.7 /100 | #95 | Exceptional 12.2% |
| Immigrants | Sweden | 97.5 /100 | #96 | Exceptional 12.2% |
| Immigrants | Italy | 97.4 /100 | #97 | Exceptional 12.2% |
| Guamanians/Chamorros | 97.4 /100 | #98 | Exceptional 12.2% |
| Immigrants | Cuba | 97.3 /100 | #99 | Exceptional 12.2% |
| Immigrants | Australia | 97.1 /100 | #100 | Exceptional 12.2% |
| Immigrants | Latvia | 97.0 /100 | #101 | Exceptional 12.2% |
| Immigrants | Europe | 97.0 /100 | #102 | Exceptional 12.2% |
| Immigrants | Armenia | 96.7 /100 | #103 | Exceptional 12.2% |
| Immigrants | Kazakhstan | 96.7 /100 | #104 | Exceptional 12.2% |
| Jordanians | 95.9 /100 | #105 | Exceptional 12.3% |
Demographics Similar to Immigrants from Saudi Arabia by Single Male Poverty
In terms of single male poverty, the demographic groups most similar to Immigrants from Saudi Arabia are Scottish (14.0%, a difference of 0.010%), Irish (14.0%, a difference of 0.030%), Mexican (14.0%, a difference of 0.090%), Immigrants from Mexico (13.9%, a difference of 0.17%), and German (13.9%, a difference of 0.23%).
| Demographics | Rating | Rank | Single Male Poverty |
| Cape Verdeans | 0.2 /100 | #263 | Tragic 13.8% |
| West Indians | 0.2 /100 | #264 | Tragic 13.8% |
| Immigrants | Congo | 0.2 /100 | #265 | Tragic 13.9% |
| Immigrants | Cabo Verde | 0.1 /100 | #266 | Tragic 13.9% |
| Germans | 0.1 /100 | #267 | Tragic 13.9% |
| Immigrants | Mexico | 0.1 /100 | #268 | Tragic 13.9% |
| Scottish | 0.1 /100 | #269 | Tragic 14.0% |
| Immigrants | Saudi Arabia | 0.1 /100 | #270 | Tragic 14.0% |
| Irish | 0.1 /100 | #271 | Tragic 14.0% |
| Mexicans | 0.1 /100 | #272 | Tragic 14.0% |
| Welsh | 0.1 /100 | #273 | Tragic 14.0% |
| Hondurans | 0.1 /100 | #274 | Tragic 14.0% |
| English | 0.1 /100 | #275 | Tragic 14.1% |
| Dutch | 0.1 /100 | #276 | Tragic 14.1% |
| Immigrants | Honduras | 0.0 /100 | #277 | Tragic 14.1% |