Guamanian/Chamorro vs Slavic Single Male Poverty
COMPARE
Guamanian/Chamorro
Slavic
Single Male Poverty
Single Male Poverty Comparison
Guamanians/Chamorros
Slavs
12.2%
SINGLE MALE POVERTY
97.4/ 100
METRIC RATING
98th/ 347
METRIC RANK
13.3%
SINGLE MALE POVERTY
5.3/ 100
METRIC RATING
231st/ 347
METRIC RANK
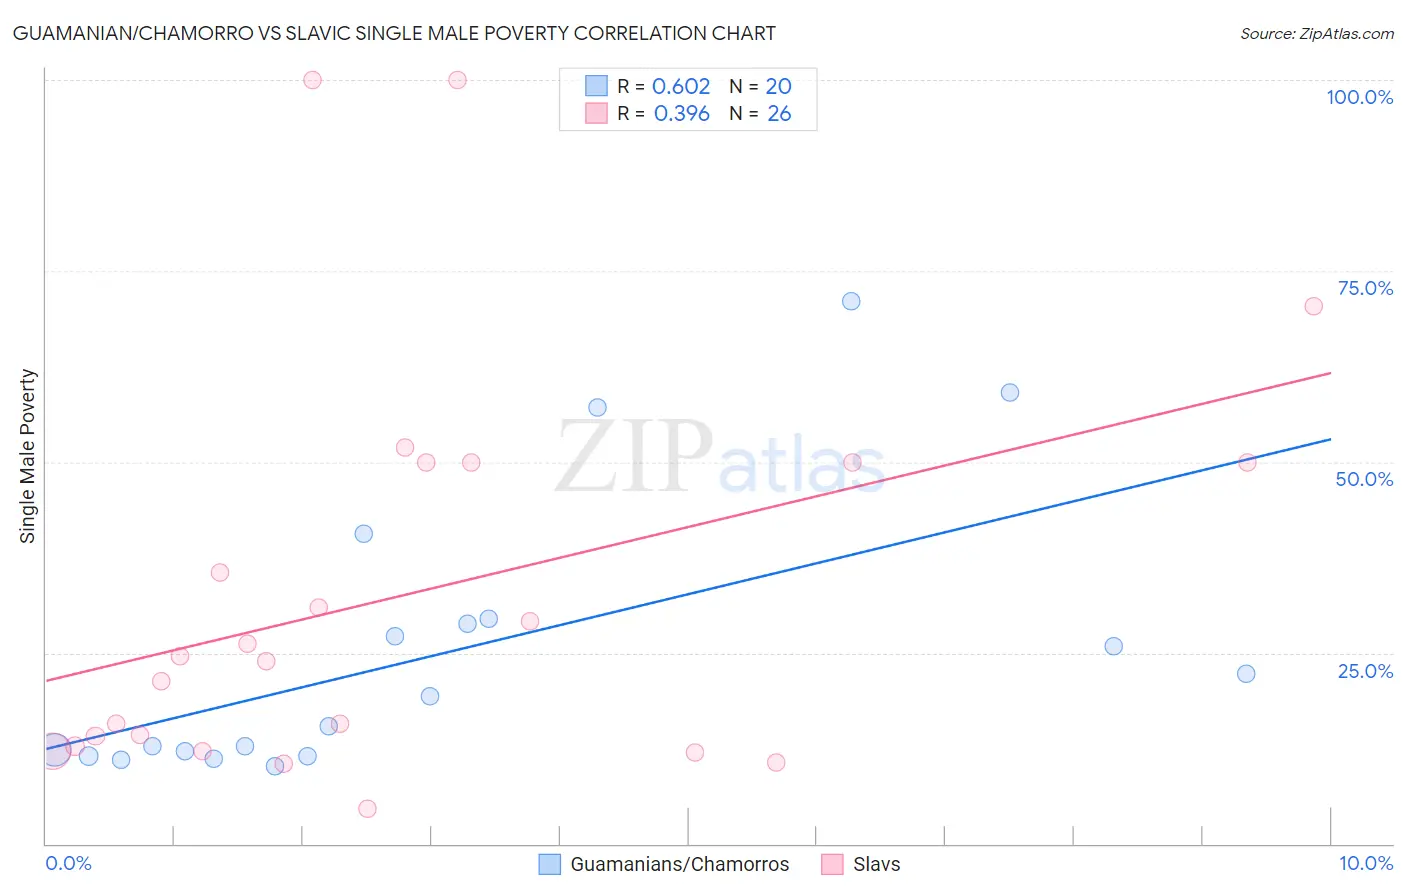
Guamanian/Chamorro vs Slavic Single Male Poverty Correlation Chart
The statistical analysis conducted on geographies consisting of 207,536,153 people shows a significant positive correlation between the proportion of Guamanians/Chamorros and poverty level among single males in the United States with a correlation coefficient (R) of 0.602 and weighted average of 12.2%. Similarly, the statistical analysis conducted on geographies consisting of 243,137,231 people shows a mild positive correlation between the proportion of Slavs and poverty level among single males in the United States with a correlation coefficient (R) of 0.396 and weighted average of 13.3%, a difference of 9.0%.
Single Male Poverty Correlation Summary
| Measurement | Guamanian/Chamorro | Slavic |
| Minimum | 10.2% | 4.5% |
| Maximum | 71.1% | 100.0% |
| Range | 60.8% | 95.5% |
| Mean | 25.1% | 32.6% |
| Median | 17.3% | 24.2% |
| Interquartile 25% (IQ1) | 11.8% | 12.8% |
| Interquartile 75% (IQ3) | 29.1% | 50.0% |
| Interquartile Range (IQR) | 17.3% | 37.2% |
| Standard Deviation (Sample) | 18.3% | 26.2% |
| Standard Deviation (Population) | 17.8% | 25.6% |
Similar Demographics by Single Male Poverty
Demographics Similar to Guamanians/Chamorros by Single Male Poverty
In terms of single male poverty, the demographic groups most similar to Guamanians/Chamorros are Immigrants from Italy (12.2%, a difference of 0.0%), Immigrants from Cuba (12.2%, a difference of 0.040%), Immigrants from Sweden (12.2%, a difference of 0.050%), Immigrants from Australia (12.2%, a difference of 0.15%), and Immigrants from Latvia (12.2%, a difference of 0.19%).
| Demographics | Rating | Rank | Single Male Poverty |
| Immigrants | Turkey | 98.2 /100 | #91 | Exceptional 12.1% |
| Spanish American Indians | 98.0 /100 | #92 | Exceptional 12.1% |
| Immigrants | Bosnia and Herzegovina | 97.9 /100 | #93 | Exceptional 12.1% |
| Colombians | 97.8 /100 | #94 | Exceptional 12.2% |
| Mongolians | 97.7 /100 | #95 | Exceptional 12.2% |
| Immigrants | Sweden | 97.5 /100 | #96 | Exceptional 12.2% |
| Immigrants | Italy | 97.4 /100 | #97 | Exceptional 12.2% |
| Guamanians/Chamorros | 97.4 /100 | #98 | Exceptional 12.2% |
| Immigrants | Cuba | 97.3 /100 | #99 | Exceptional 12.2% |
| Immigrants | Australia | 97.1 /100 | #100 | Exceptional 12.2% |
| Immigrants | Latvia | 97.0 /100 | #101 | Exceptional 12.2% |
| Immigrants | Europe | 97.0 /100 | #102 | Exceptional 12.2% |
| Immigrants | Armenia | 96.7 /100 | #103 | Exceptional 12.2% |
| Immigrants | Kazakhstan | 96.7 /100 | #104 | Exceptional 12.2% |
| Jordanians | 95.9 /100 | #105 | Exceptional 12.3% |
Demographics Similar to Slavs by Single Male Poverty
In terms of single male poverty, the demographic groups most similar to Slavs are Immigrants from Caribbean (13.3%, a difference of 0.090%), Ghanaian (13.3%, a difference of 0.18%), European (13.3%, a difference of 0.20%), Lebanese (13.2%, a difference of 0.30%), and Haitian (13.2%, a difference of 0.38%).
| Demographics | Rating | Rank | Single Male Poverty |
| Somalis | 9.1 /100 | #224 | Tragic 13.2% |
| Immigrants | Denmark | 8.7 /100 | #225 | Tragic 13.2% |
| Jamaicans | 7.7 /100 | #226 | Tragic 13.2% |
| Haitians | 7.0 /100 | #227 | Tragic 13.2% |
| Lebanese | 6.6 /100 | #228 | Tragic 13.2% |
| Europeans | 6.2 /100 | #229 | Tragic 13.3% |
| Ghanaians | 6.1 /100 | #230 | Tragic 13.3% |
| Slavs | 5.3 /100 | #231 | Tragic 13.3% |
| Immigrants | Caribbean | 5.0 /100 | #232 | Tragic 13.3% |
| British | 4.0 /100 | #233 | Tragic 13.3% |
| Canadians | 4.0 /100 | #234 | Tragic 13.3% |
| Bangladeshis | 3.7 /100 | #235 | Tragic 13.3% |
| Luxembourgers | 3.6 /100 | #236 | Tragic 13.4% |
| British West Indians | 3.4 /100 | #237 | Tragic 13.4% |
| Immigrants | Ghana | 3.2 /100 | #238 | Tragic 13.4% |