Immigrants from Zaire vs Immigrants from Sudan Single Male Poverty
COMPARE
Immigrants from Zaire
Immigrants from Sudan
Single Male Poverty
Single Male Poverty Comparison
Immigrants from Zaire
Immigrants from Sudan
13.6%
SINGLE MALE POVERTY
0.9/ 100
METRIC RATING
251st/ 347
METRIC RANK
12.7%
SINGLE MALE POVERTY
58.2/ 100
METRIC RATING
167th/ 347
METRIC RANK
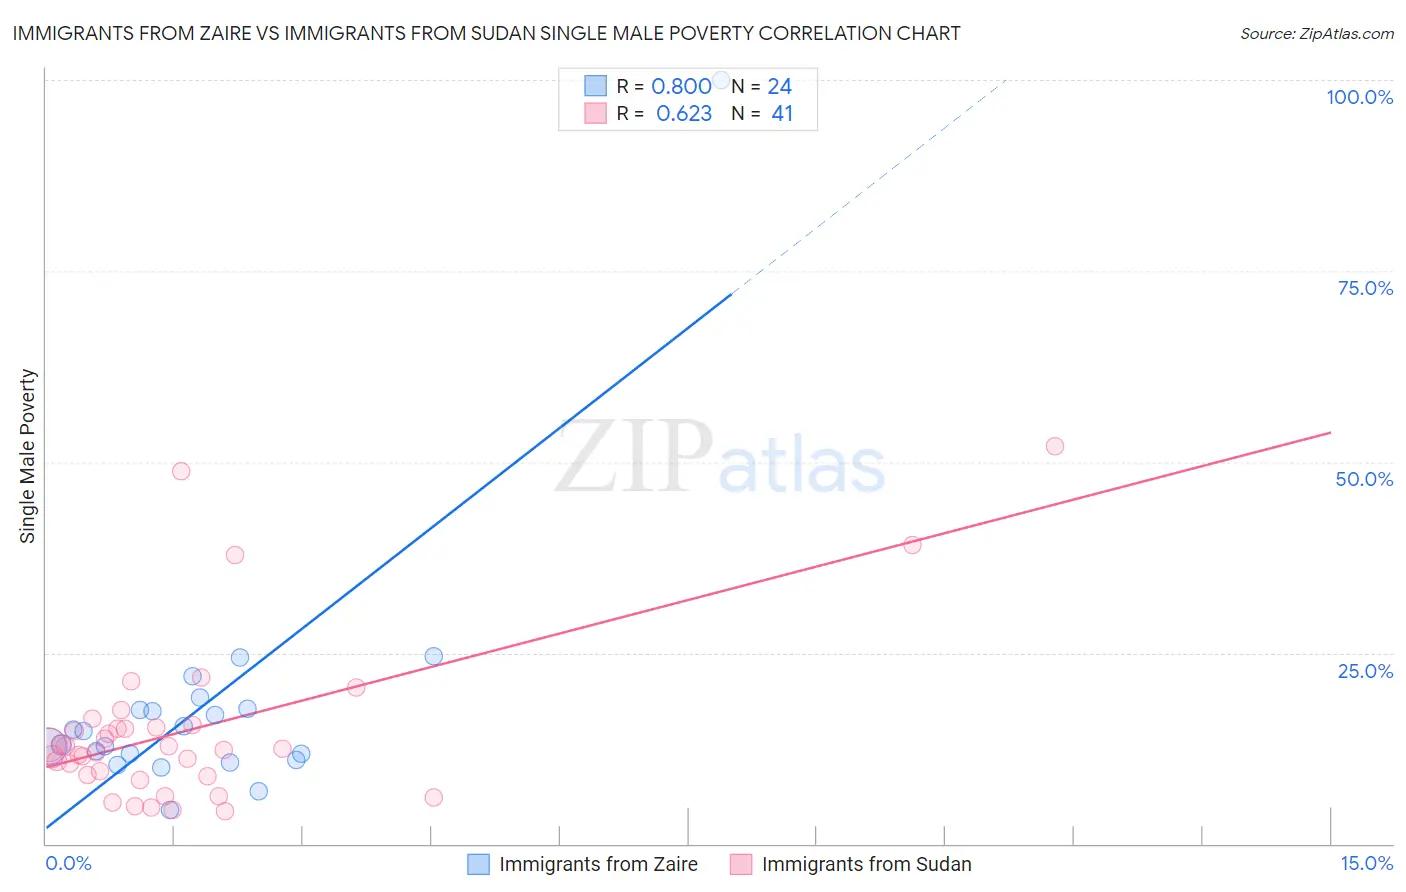
Immigrants from Zaire vs Immigrants from Sudan Single Male Poverty Correlation Chart
The statistical analysis conducted on geographies consisting of 103,503,403 people shows a strong positive correlation between the proportion of Immigrants from Zaire and poverty level among single males in the United States with a correlation coefficient (R) of 0.800 and weighted average of 13.6%. Similarly, the statistical analysis conducted on geographies consisting of 114,680,115 people shows a significant positive correlation between the proportion of Immigrants from Sudan and poverty level among single males in the United States with a correlation coefficient (R) of 0.623 and weighted average of 12.7%, a difference of 6.7%.
Single Male Poverty Correlation Summary
| Measurement | Immigrants from Zaire | Immigrants from Sudan |
| Minimum | 4.4% | 4.2% |
| Maximum | 100.0% | 52.0% |
| Range | 95.6% | 47.8% |
| Mean | 18.0% | 14.9% |
| Median | 13.8% | 12.5% |
| Interquartile 25% (IQ1) | 11.3% | 8.9% |
| Interquartile 75% (IQ3) | 17.6% | 15.4% |
| Interquartile Range (IQR) | 6.2% | 6.5% |
| Standard Deviation (Sample) | 18.2% | 10.9% |
| Standard Deviation (Population) | 17.8% | 10.8% |
Similar Demographics by Single Male Poverty
Demographics Similar to Immigrants from Zaire by Single Male Poverty
In terms of single male poverty, the demographic groups most similar to Immigrants from Zaire are Finnish (13.6%, a difference of 0.050%), Immigrants from Somalia (13.6%, a difference of 0.11%), Spanish (13.6%, a difference of 0.13%), German Russian (13.6%, a difference of 0.19%), and Czech (13.5%, a difference of 0.37%).
| Demographics | Rating | Rank | Single Male Poverty |
| Immigrants | Senegal | 1.7 /100 | #244 | Tragic 13.5% |
| Immigrants | Latin America | 1.3 /100 | #245 | Tragic 13.5% |
| Immigrants | Micronesia | 1.2 /100 | #246 | Tragic 13.5% |
| Belgians | 1.2 /100 | #247 | Tragic 13.5% |
| Czechs | 1.2 /100 | #248 | Tragic 13.5% |
| Spanish | 1.0 /100 | #249 | Tragic 13.6% |
| Immigrants | Somalia | 1.0 /100 | #250 | Tragic 13.6% |
| Immigrants | Zaire | 0.9 /100 | #251 | Tragic 13.6% |
| Finns | 0.9 /100 | #252 | Tragic 13.6% |
| German Russians | 0.8 /100 | #253 | Tragic 13.6% |
| Sub-Saharan Africans | 0.5 /100 | #254 | Tragic 13.7% |
| Spaniards | 0.4 /100 | #255 | Tragic 13.7% |
| Immigrants | Belize | 0.4 /100 | #256 | Tragic 13.7% |
| Immigrants | Central America | 0.3 /100 | #257 | Tragic 13.8% |
| Immigrants | Guatemala | 0.3 /100 | #258 | Tragic 13.8% |
Demographics Similar to Immigrants from Sudan by Single Male Poverty
In terms of single male poverty, the demographic groups most similar to Immigrants from Sudan are Immigrants from Barbados (12.7%, a difference of 0.030%), Immigrants from Guyana (12.7%, a difference of 0.13%), Puget Sound Salish (12.8%, a difference of 0.21%), Immigrants from Cambodia (12.7%, a difference of 0.22%), and Immigrants from Nigeria (12.7%, a difference of 0.26%).
| Demographics | Rating | Rank | Single Male Poverty |
| Greeks | 64.1 /100 | #160 | Good 12.7% |
| Immigrants | Africa | 63.4 /100 | #161 | Good 12.7% |
| Eastern Europeans | 63.3 /100 | #162 | Good 12.7% |
| Palestinians | 63.1 /100 | #163 | Good 12.7% |
| Immigrants | Nigeria | 62.8 /100 | #164 | Good 12.7% |
| Immigrants | Cambodia | 62.2 /100 | #165 | Good 12.7% |
| Immigrants | Guyana | 60.5 /100 | #166 | Good 12.7% |
| Immigrants | Sudan | 58.2 /100 | #167 | Average 12.7% |
| Immigrants | Barbados | 57.7 /100 | #168 | Average 12.7% |
| Puget Sound Salish | 54.3 /100 | #169 | Average 12.8% |
| Guyanese | 52.0 /100 | #170 | Average 12.8% |
| South Africans | 51.5 /100 | #171 | Average 12.8% |
| Danes | 51.4 /100 | #172 | Average 12.8% |
| Immigrants | St. Vincent and the Grenadines | 50.9 /100 | #173 | Average 12.8% |
| Costa Ricans | 50.0 /100 | #174 | Average 12.8% |