Guamanian/Chamorro vs Costa Rican Single Male Poverty
COMPARE
Guamanian/Chamorro
Costa Rican
Single Male Poverty
Single Male Poverty Comparison
Guamanians/Chamorros
Costa Ricans
12.2%
SINGLE MALE POVERTY
97.4/ 100
METRIC RATING
98th/ 347
METRIC RANK
12.8%
SINGLE MALE POVERTY
50.0/ 100
METRIC RATING
174th/ 347
METRIC RANK
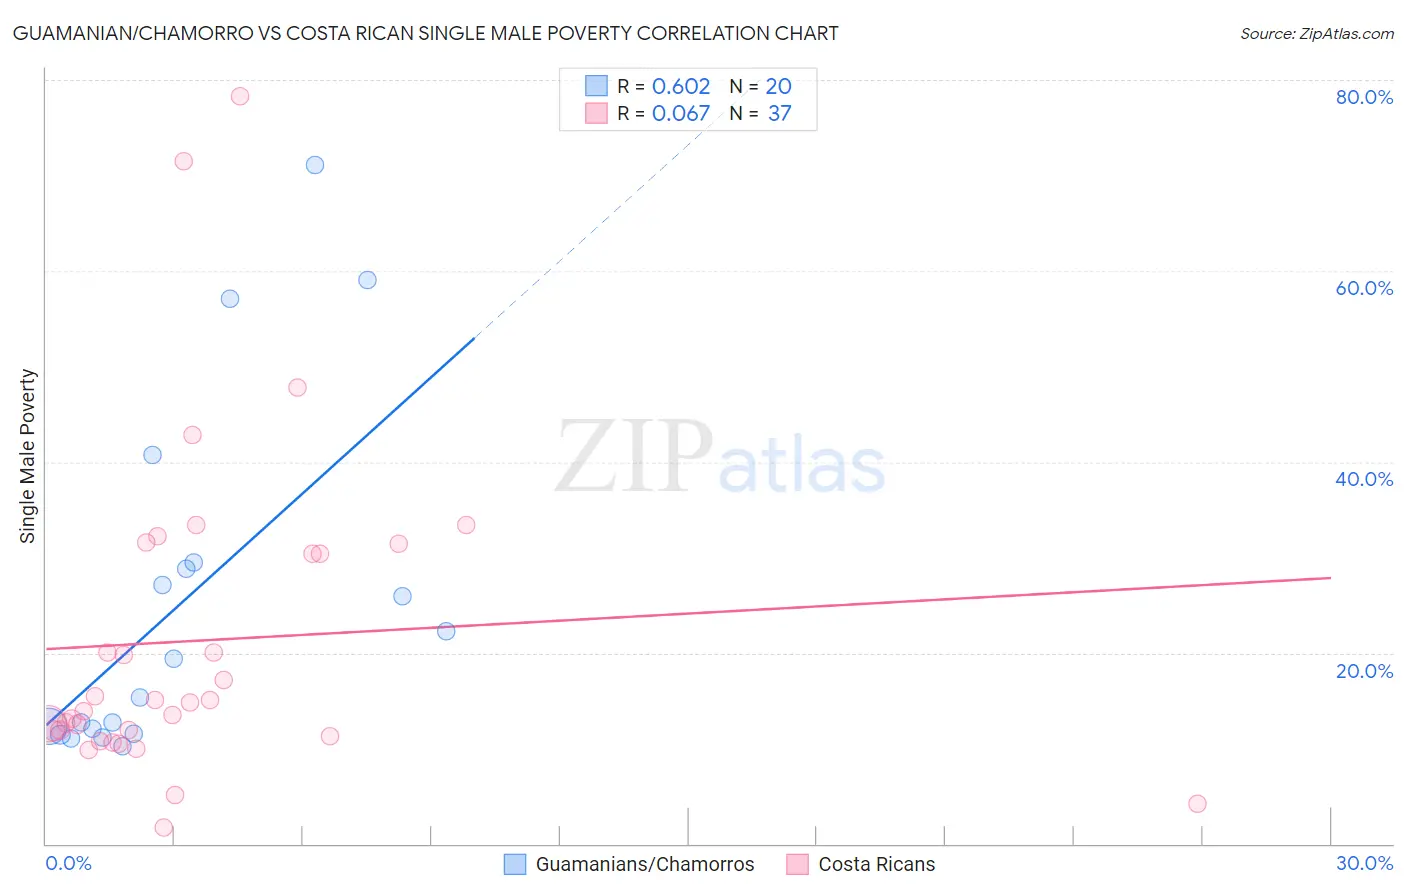
Guamanian/Chamorro vs Costa Rican Single Male Poverty Correlation Chart
The statistical analysis conducted on geographies consisting of 207,536,153 people shows a significant positive correlation between the proportion of Guamanians/Chamorros and poverty level among single males in the United States with a correlation coefficient (R) of 0.602 and weighted average of 12.2%. Similarly, the statistical analysis conducted on geographies consisting of 235,048,868 people shows a slight positive correlation between the proportion of Costa Ricans and poverty level among single males in the United States with a correlation coefficient (R) of 0.067 and weighted average of 12.8%, a difference of 5.0%.
Single Male Poverty Correlation Summary
| Measurement | Guamanian/Chamorro | Costa Rican |
| Minimum | 10.2% | 1.6% |
| Maximum | 71.1% | 78.3% |
| Range | 60.8% | 76.6% |
| Mean | 25.1% | 21.3% |
| Median | 17.3% | 14.7% |
| Interquartile 25% (IQ1) | 11.8% | 11.5% |
| Interquartile 75% (IQ3) | 29.1% | 30.9% |
| Interquartile Range (IQR) | 17.3% | 19.4% |
| Standard Deviation (Sample) | 18.3% | 16.8% |
| Standard Deviation (Population) | 17.8% | 16.6% |
Similar Demographics by Single Male Poverty
Demographics Similar to Guamanians/Chamorros by Single Male Poverty
In terms of single male poverty, the demographic groups most similar to Guamanians/Chamorros are Immigrants from Italy (12.2%, a difference of 0.0%), Immigrants from Cuba (12.2%, a difference of 0.040%), Immigrants from Sweden (12.2%, a difference of 0.050%), Immigrants from Australia (12.2%, a difference of 0.15%), and Immigrants from Latvia (12.2%, a difference of 0.19%).
| Demographics | Rating | Rank | Single Male Poverty |
| Immigrants | Turkey | 98.2 /100 | #91 | Exceptional 12.1% |
| Spanish American Indians | 98.0 /100 | #92 | Exceptional 12.1% |
| Immigrants | Bosnia and Herzegovina | 97.9 /100 | #93 | Exceptional 12.1% |
| Colombians | 97.8 /100 | #94 | Exceptional 12.2% |
| Mongolians | 97.7 /100 | #95 | Exceptional 12.2% |
| Immigrants | Sweden | 97.5 /100 | #96 | Exceptional 12.2% |
| Immigrants | Italy | 97.4 /100 | #97 | Exceptional 12.2% |
| Guamanians/Chamorros | 97.4 /100 | #98 | Exceptional 12.2% |
| Immigrants | Cuba | 97.3 /100 | #99 | Exceptional 12.2% |
| Immigrants | Australia | 97.1 /100 | #100 | Exceptional 12.2% |
| Immigrants | Latvia | 97.0 /100 | #101 | Exceptional 12.2% |
| Immigrants | Europe | 97.0 /100 | #102 | Exceptional 12.2% |
| Immigrants | Armenia | 96.7 /100 | #103 | Exceptional 12.2% |
| Immigrants | Kazakhstan | 96.7 /100 | #104 | Exceptional 12.2% |
| Jordanians | 95.9 /100 | #105 | Exceptional 12.3% |
Demographics Similar to Costa Ricans by Single Male Poverty
In terms of single male poverty, the demographic groups most similar to Costa Ricans are Immigrants from St. Vincent and the Grenadines (12.8%, a difference of 0.050%), Croatian (12.8%, a difference of 0.060%), South African (12.8%, a difference of 0.080%), Danish (12.8%, a difference of 0.080%), and Syrian (12.8%, a difference of 0.080%).
| Demographics | Rating | Rank | Single Male Poverty |
| Immigrants | Sudan | 58.2 /100 | #167 | Average 12.7% |
| Immigrants | Barbados | 57.7 /100 | #168 | Average 12.7% |
| Puget Sound Salish | 54.3 /100 | #169 | Average 12.8% |
| Guyanese | 52.0 /100 | #170 | Average 12.8% |
| South Africans | 51.5 /100 | #171 | Average 12.8% |
| Danes | 51.4 /100 | #172 | Average 12.8% |
| Immigrants | St. Vincent and the Grenadines | 50.9 /100 | #173 | Average 12.8% |
| Costa Ricans | 50.0 /100 | #174 | Average 12.8% |
| Croatians | 48.9 /100 | #175 | Average 12.8% |
| Syrians | 48.4 /100 | #176 | Average 12.8% |
| Immigrants | Canada | 44.8 /100 | #177 | Average 12.8% |
| Immigrants | Switzerland | 43.1 /100 | #178 | Average 12.8% |
| Israelis | 41.0 /100 | #179 | Average 12.9% |
| Immigrants | North America | 37.7 /100 | #180 | Fair 12.9% |
| Panamanians | 37.6 /100 | #181 | Fair 12.9% |