Spaniard vs Immigrants from Sudan Single Male Poverty
COMPARE
Spaniard
Immigrants from Sudan
Single Male Poverty
Single Male Poverty Comparison
Spaniards
Immigrants from Sudan
13.7%
SINGLE MALE POVERTY
0.4/ 100
METRIC RATING
255th/ 347
METRIC RANK
12.7%
SINGLE MALE POVERTY
58.2/ 100
METRIC RATING
167th/ 347
METRIC RANK
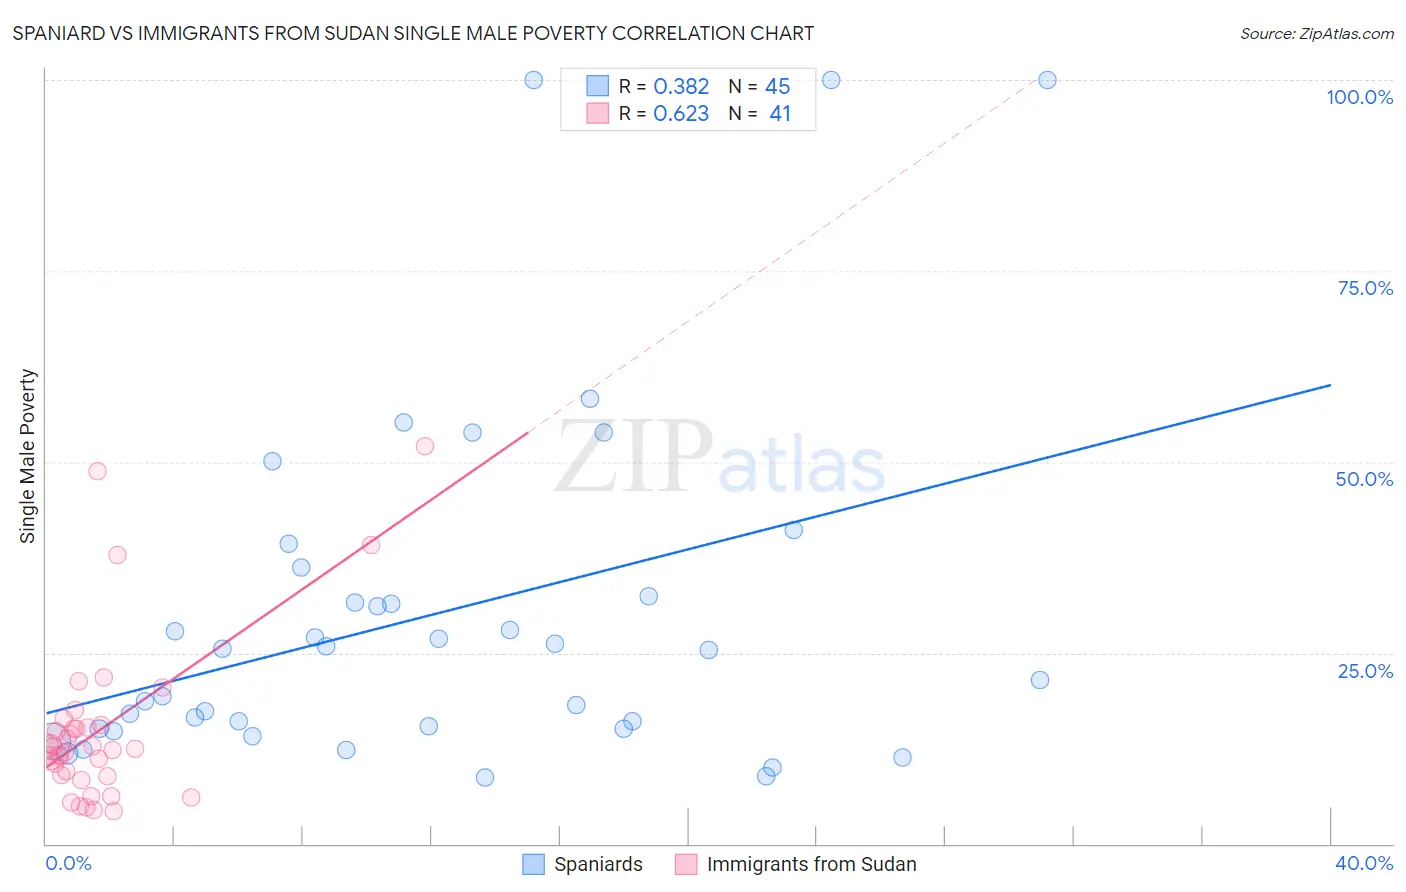
Spaniard vs Immigrants from Sudan Single Male Poverty Correlation Chart
The statistical analysis conducted on geographies consisting of 390,345,278 people shows a mild positive correlation between the proportion of Spaniards and poverty level among single males in the United States with a correlation coefficient (R) of 0.382 and weighted average of 13.7%. Similarly, the statistical analysis conducted on geographies consisting of 114,680,115 people shows a significant positive correlation between the proportion of Immigrants from Sudan and poverty level among single males in the United States with a correlation coefficient (R) of 0.623 and weighted average of 12.7%, a difference of 7.6%.
Single Male Poverty Correlation Summary
| Measurement | Spaniard | Immigrants from Sudan |
| Minimum | 8.7% | 4.2% |
| Maximum | 100.0% | 52.0% |
| Range | 91.3% | 47.8% |
| Mean | 30.0% | 14.9% |
| Median | 25.4% | 12.5% |
| Interquartile 25% (IQ1) | 15.0% | 8.9% |
| Interquartile 75% (IQ3) | 34.3% | 15.4% |
| Interquartile Range (IQR) | 19.3% | 6.5% |
| Standard Deviation (Sample) | 23.1% | 10.9% |
| Standard Deviation (Population) | 22.8% | 10.8% |
Similar Demographics by Single Male Poverty
Demographics Similar to Spaniards by Single Male Poverty
In terms of single male poverty, the demographic groups most similar to Spaniards are Immigrants from Belize (13.7%, a difference of 0.10%), Subsaharan African (13.7%, a difference of 0.11%), Immigrants from Central America (13.8%, a difference of 0.29%), Immigrants from Guatemala (13.8%, a difference of 0.35%), and Guatemalan (13.8%, a difference of 0.39%).
| Demographics | Rating | Rank | Single Male Poverty |
| Czechs | 1.2 /100 | #248 | Tragic 13.5% |
| Spanish | 1.0 /100 | #249 | Tragic 13.6% |
| Immigrants | Somalia | 1.0 /100 | #250 | Tragic 13.6% |
| Immigrants | Zaire | 0.9 /100 | #251 | Tragic 13.6% |
| Finns | 0.9 /100 | #252 | Tragic 13.6% |
| German Russians | 0.8 /100 | #253 | Tragic 13.6% |
| Sub-Saharan Africans | 0.5 /100 | #254 | Tragic 13.7% |
| Spaniards | 0.4 /100 | #255 | Tragic 13.7% |
| Immigrants | Belize | 0.4 /100 | #256 | Tragic 13.7% |
| Immigrants | Central America | 0.3 /100 | #257 | Tragic 13.8% |
| Immigrants | Guatemala | 0.3 /100 | #258 | Tragic 13.8% |
| Guatemalans | 0.3 /100 | #259 | Tragic 13.8% |
| Swiss | 0.3 /100 | #260 | Tragic 13.8% |
| Hungarians | 0.3 /100 | #261 | Tragic 13.8% |
| Fijians | 0.3 /100 | #262 | Tragic 13.8% |
Demographics Similar to Immigrants from Sudan by Single Male Poverty
In terms of single male poverty, the demographic groups most similar to Immigrants from Sudan are Immigrants from Barbados (12.7%, a difference of 0.030%), Immigrants from Guyana (12.7%, a difference of 0.13%), Puget Sound Salish (12.8%, a difference of 0.21%), Immigrants from Cambodia (12.7%, a difference of 0.22%), and Immigrants from Nigeria (12.7%, a difference of 0.26%).
| Demographics | Rating | Rank | Single Male Poverty |
| Greeks | 64.1 /100 | #160 | Good 12.7% |
| Immigrants | Africa | 63.4 /100 | #161 | Good 12.7% |
| Eastern Europeans | 63.3 /100 | #162 | Good 12.7% |
| Palestinians | 63.1 /100 | #163 | Good 12.7% |
| Immigrants | Nigeria | 62.8 /100 | #164 | Good 12.7% |
| Immigrants | Cambodia | 62.2 /100 | #165 | Good 12.7% |
| Immigrants | Guyana | 60.5 /100 | #166 | Good 12.7% |
| Immigrants | Sudan | 58.2 /100 | #167 | Average 12.7% |
| Immigrants | Barbados | 57.7 /100 | #168 | Average 12.7% |
| Puget Sound Salish | 54.3 /100 | #169 | Average 12.8% |
| Guyanese | 52.0 /100 | #170 | Average 12.8% |
| South Africans | 51.5 /100 | #171 | Average 12.8% |
| Danes | 51.4 /100 | #172 | Average 12.8% |
| Immigrants | St. Vincent and the Grenadines | 50.9 /100 | #173 | Average 12.8% |
| Costa Ricans | 50.0 /100 | #174 | Average 12.8% |