Ghanaian vs Immigrants from Honduras Single Mother Poverty
COMPARE
Ghanaian
Immigrants from Honduras
Single Mother Poverty
Single Mother Poverty Comparison
Ghanaians
Immigrants from Honduras
29.4%
SINGLE MOTHER POVERTY
36.8/ 100
METRIC RATING
185th/ 347
METRIC RANK
34.7%
SINGLE MOTHER POVERTY
0.0/ 100
METRIC RATING
318th/ 347
METRIC RANK
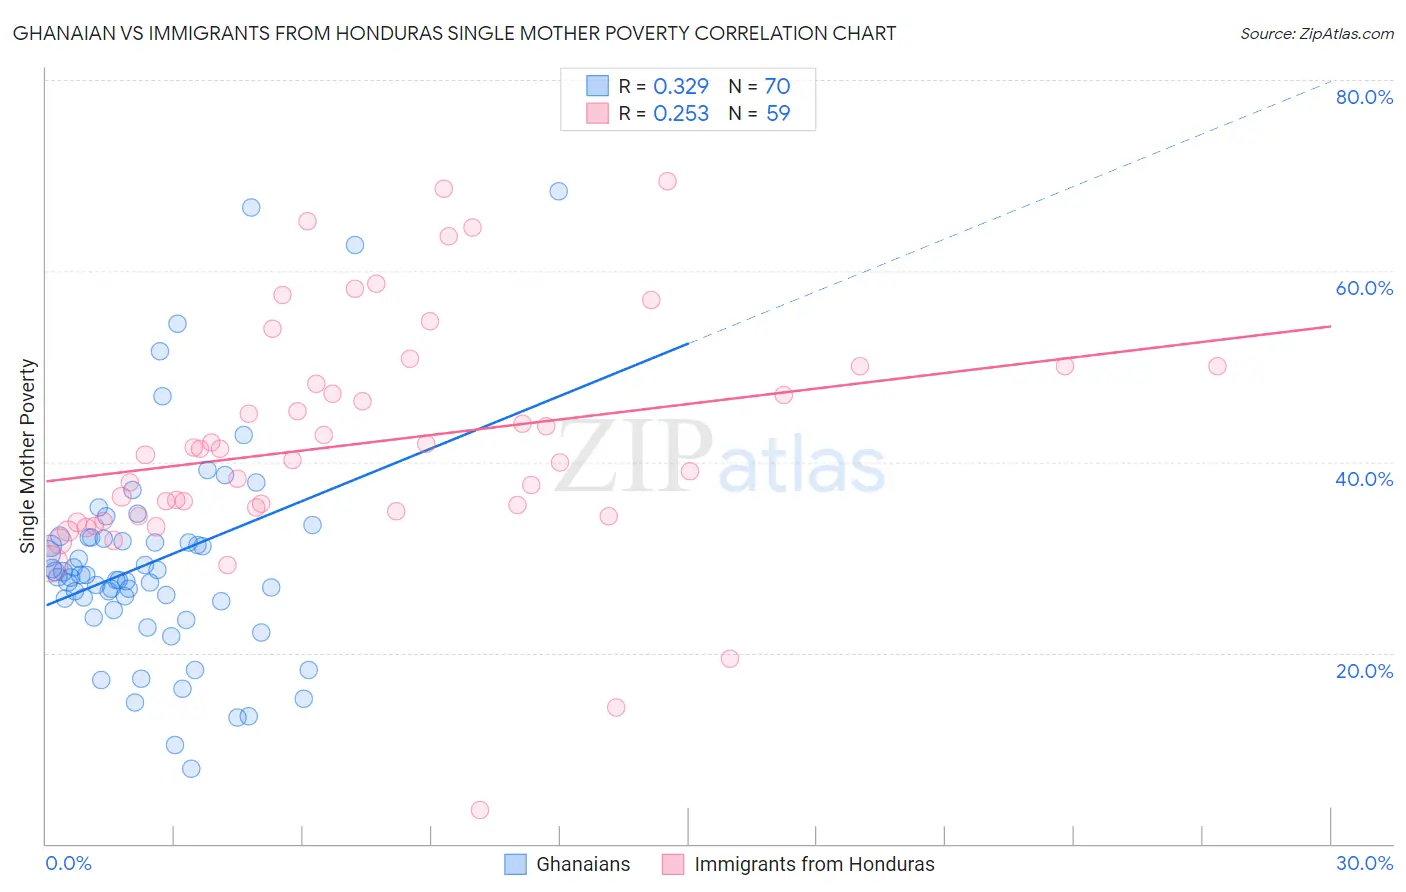
Ghanaian vs Immigrants from Honduras Single Mother Poverty Correlation Chart
The statistical analysis conducted on geographies consisting of 188,697,723 people shows a mild positive correlation between the proportion of Ghanaians and poverty level among single mothers in the United States with a correlation coefficient (R) of 0.329 and weighted average of 29.4%. Similarly, the statistical analysis conducted on geographies consisting of 318,969,615 people shows a weak positive correlation between the proportion of Immigrants from Honduras and poverty level among single mothers in the United States with a correlation coefficient (R) of 0.253 and weighted average of 34.7%, a difference of 18.2%.
Single Mother Poverty Correlation Summary
| Measurement | Ghanaian | Immigrants from Honduras |
| Minimum | 7.9% | 3.6% |
| Maximum | 68.3% | 69.4% |
| Range | 60.4% | 65.9% |
| Mean | 29.6% | 42.0% |
| Median | 28.0% | 40.7% |
| Interquartile 25% (IQ1) | 25.4% | 34.3% |
| Interquartile 75% (IQ3) | 32.0% | 50.0% |
| Interquartile Range (IQR) | 6.6% | 15.7% |
| Standard Deviation (Sample) | 11.4% | 12.4% |
| Standard Deviation (Population) | 11.3% | 12.3% |
Similar Demographics by Single Mother Poverty
Demographics Similar to Ghanaians by Single Mother Poverty
In terms of single mother poverty, the demographic groups most similar to Ghanaians are Yugoslavian (29.4%, a difference of 0.040%), Nigerian (29.3%, a difference of 0.060%), Nepalese (29.3%, a difference of 0.070%), Immigrants from Eastern Africa (29.3%, a difference of 0.090%), and Canadian (29.3%, a difference of 0.18%).
| Demographics | Rating | Rank | Single Mother Poverty |
| South American Indians | 43.2 /100 | #178 | Average 29.3% |
| Immigrants | Uzbekistan | 42.6 /100 | #179 | Average 29.3% |
| Immigrants | Norway | 41.5 /100 | #180 | Average 29.3% |
| Canadians | 40.4 /100 | #181 | Average 29.3% |
| Immigrants | Eastern Africa | 38.5 /100 | #182 | Fair 29.3% |
| Nepalese | 38.3 /100 | #183 | Fair 29.3% |
| Nigerians | 38.0 /100 | #184 | Fair 29.3% |
| Ghanaians | 36.8 /100 | #185 | Fair 29.4% |
| Yugoslavians | 36.0 /100 | #186 | Fair 29.4% |
| Lebanese | 32.5 /100 | #187 | Fair 29.4% |
| Guamanians/Chamorros | 31.8 /100 | #188 | Fair 29.4% |
| Immigrants | Africa | 31.6 /100 | #189 | Fair 29.4% |
| Immigrants | Germany | 30.4 /100 | #190 | Fair 29.5% |
| Immigrants | Trinidad and Tobago | 29.2 /100 | #191 | Fair 29.5% |
| Moroccans | 28.6 /100 | #192 | Fair 29.5% |
Demographics Similar to Immigrants from Honduras by Single Mother Poverty
In terms of single mother poverty, the demographic groups most similar to Immigrants from Honduras are Chippewa (34.8%, a difference of 0.15%), Iroquois (34.8%, a difference of 0.39%), Cherokee (34.5%, a difference of 0.52%), Dominican (34.5%, a difference of 0.63%), and Hopi (34.5%, a difference of 0.75%).
| Demographics | Rating | Rank | Single Mother Poverty |
| Alsatians | 0.0 /100 | #311 | Tragic 34.3% |
| Central American Indians | 0.0 /100 | #312 | Tragic 34.3% |
| Immigrants | Dominican Republic | 0.0 /100 | #313 | Tragic 34.4% |
| Chickasaw | 0.0 /100 | #314 | Tragic 34.4% |
| Hopi | 0.0 /100 | #315 | Tragic 34.5% |
| Dominicans | 0.0 /100 | #316 | Tragic 34.5% |
| Cherokee | 0.0 /100 | #317 | Tragic 34.5% |
| Immigrants | Honduras | 0.0 /100 | #318 | Tragic 34.7% |
| Chippewa | 0.0 /100 | #319 | Tragic 34.8% |
| Iroquois | 0.0 /100 | #320 | Tragic 34.8% |
| Paiute | 0.0 /100 | #321 | Tragic 35.1% |
| Blacks/African Americans | 0.0 /100 | #322 | Tragic 35.2% |
| Kiowa | 0.0 /100 | #323 | Tragic 35.5% |
| Ottawa | 0.0 /100 | #324 | Tragic 35.5% |
| Ute | 0.0 /100 | #325 | Tragic 35.7% |