Czech vs Immigrants from Honduras Single Mother Poverty
COMPARE
Czech
Immigrants from Honduras
Single Mother Poverty
Single Mother Poverty Comparison
Czechs
Immigrants from Honduras
28.9%
SINGLE MOTHER POVERTY
68.4/ 100
METRIC RATING
159th/ 347
METRIC RANK
34.7%
SINGLE MOTHER POVERTY
0.0/ 100
METRIC RATING
318th/ 347
METRIC RANK
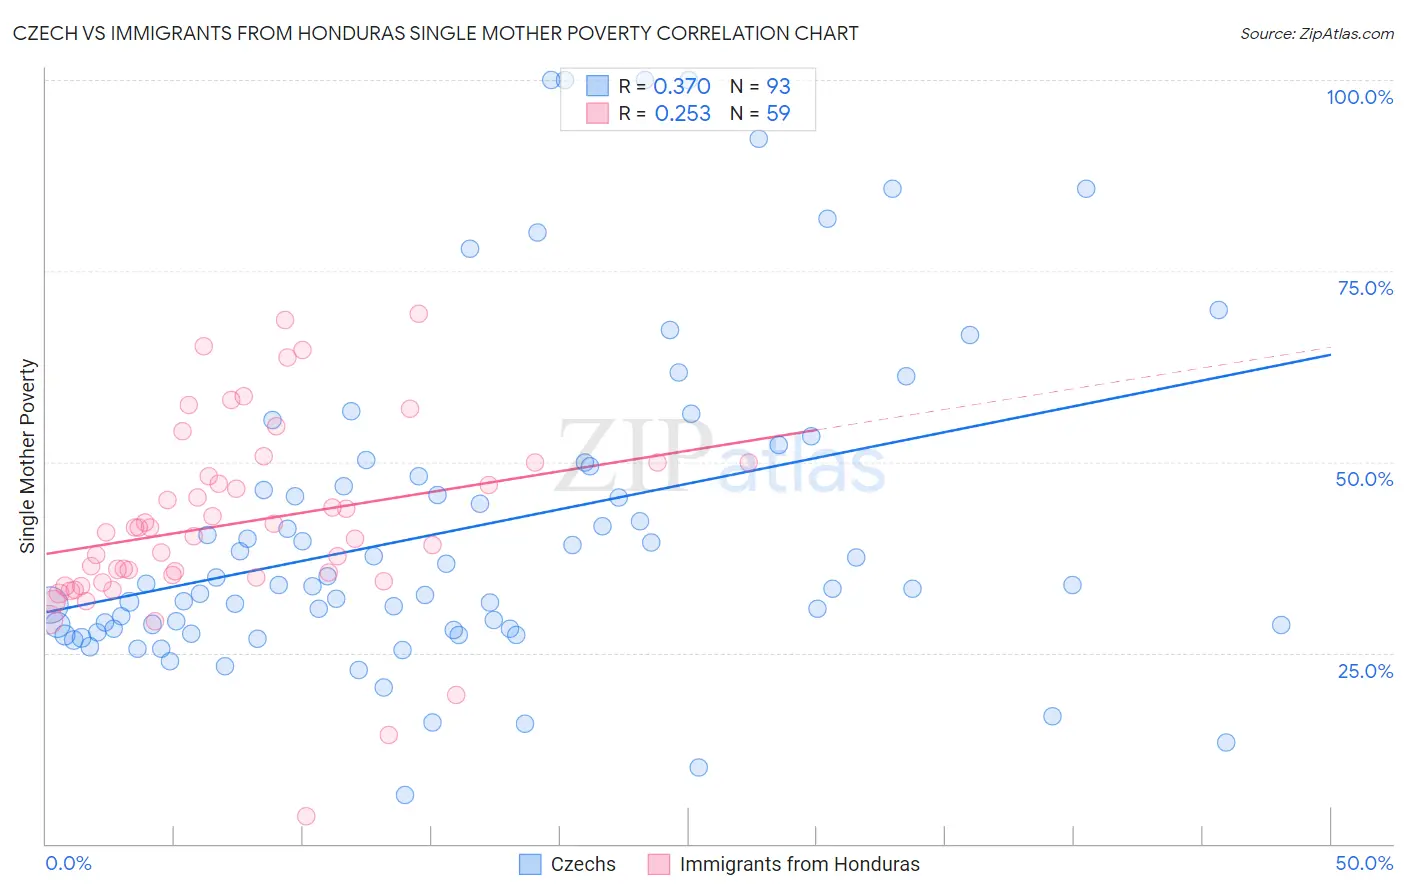
Czech vs Immigrants from Honduras Single Mother Poverty Correlation Chart
The statistical analysis conducted on geographies consisting of 466,588,307 people shows a mild positive correlation between the proportion of Czechs and poverty level among single mothers in the United States with a correlation coefficient (R) of 0.370 and weighted average of 28.9%. Similarly, the statistical analysis conducted on geographies consisting of 318,969,615 people shows a weak positive correlation between the proportion of Immigrants from Honduras and poverty level among single mothers in the United States with a correlation coefficient (R) of 0.253 and weighted average of 34.7%, a difference of 20.1%.
Single Mother Poverty Correlation Summary
| Measurement | Czech | Immigrants from Honduras |
| Minimum | 6.4% | 3.6% |
| Maximum | 100.0% | 69.4% |
| Range | 93.6% | 65.9% |
| Mean | 41.3% | 42.0% |
| Median | 33.8% | 40.7% |
| Interquartile 25% (IQ1) | 28.1% | 34.3% |
| Interquartile 75% (IQ3) | 48.7% | 50.0% |
| Interquartile Range (IQR) | 20.7% | 15.7% |
| Standard Deviation (Sample) | 21.1% | 12.4% |
| Standard Deviation (Population) | 21.0% | 12.3% |
Similar Demographics by Single Mother Poverty
Demographics Similar to Czechs by Single Mother Poverty
In terms of single mother poverty, the demographic groups most similar to Czechs are Japanese (28.9%, a difference of 0.020%), Immigrants from Cambodia (28.9%, a difference of 0.10%), Immigrants from Hungary (28.9%, a difference of 0.12%), Scandinavian (28.9%, a difference of 0.12%), and Immigrants from Nigeria (28.9%, a difference of 0.14%).
| Demographics | Rating | Rank | Single Mother Poverty |
| Austrians | 79.0 /100 | #152 | Good 28.7% |
| Slovenes | 76.4 /100 | #153 | Good 28.8% |
| Portuguese | 73.2 /100 | #154 | Good 28.8% |
| Ugandans | 71.7 /100 | #155 | Good 28.8% |
| Iraqis | 71.5 /100 | #156 | Good 28.8% |
| Immigrants | Western Europe | 71.1 /100 | #157 | Good 28.9% |
| Immigrants | Hungary | 70.6 /100 | #158 | Good 28.9% |
| Czechs | 68.4 /100 | #159 | Good 28.9% |
| Japanese | 68.0 /100 | #160 | Good 28.9% |
| Immigrants | Cambodia | 66.6 /100 | #161 | Good 28.9% |
| Scandinavians | 66.2 /100 | #162 | Good 28.9% |
| Immigrants | Nigeria | 65.9 /100 | #163 | Good 28.9% |
| Immigrants | Kenya | 65.9 /100 | #164 | Good 28.9% |
| Arabs | 60.7 /100 | #165 | Good 29.0% |
| Inupiat | 60.4 /100 | #166 | Good 29.0% |
Demographics Similar to Immigrants from Honduras by Single Mother Poverty
In terms of single mother poverty, the demographic groups most similar to Immigrants from Honduras are Chippewa (34.8%, a difference of 0.15%), Iroquois (34.8%, a difference of 0.39%), Cherokee (34.5%, a difference of 0.52%), Dominican (34.5%, a difference of 0.63%), and Hopi (34.5%, a difference of 0.75%).
| Demographics | Rating | Rank | Single Mother Poverty |
| Alsatians | 0.0 /100 | #311 | Tragic 34.3% |
| Central American Indians | 0.0 /100 | #312 | Tragic 34.3% |
| Immigrants | Dominican Republic | 0.0 /100 | #313 | Tragic 34.4% |
| Chickasaw | 0.0 /100 | #314 | Tragic 34.4% |
| Hopi | 0.0 /100 | #315 | Tragic 34.5% |
| Dominicans | 0.0 /100 | #316 | Tragic 34.5% |
| Cherokee | 0.0 /100 | #317 | Tragic 34.5% |
| Immigrants | Honduras | 0.0 /100 | #318 | Tragic 34.7% |
| Chippewa | 0.0 /100 | #319 | Tragic 34.8% |
| Iroquois | 0.0 /100 | #320 | Tragic 34.8% |
| Paiute | 0.0 /100 | #321 | Tragic 35.1% |
| Blacks/African Americans | 0.0 /100 | #322 | Tragic 35.2% |
| Kiowa | 0.0 /100 | #323 | Tragic 35.5% |
| Ottawa | 0.0 /100 | #324 | Tragic 35.5% |
| Ute | 0.0 /100 | #325 | Tragic 35.7% |