Ghanaian vs Haitian Single Mother Poverty
COMPARE
Ghanaian
Haitian
Single Mother Poverty
Single Mother Poverty Comparison
Ghanaians
Haitians
29.4%
SINGLE MOTHER POVERTY
36.8/ 100
METRIC RATING
185th/ 347
METRIC RANK
29.8%
SINGLE MOTHER POVERTY
13.3/ 100
METRIC RATING
210th/ 347
METRIC RANK
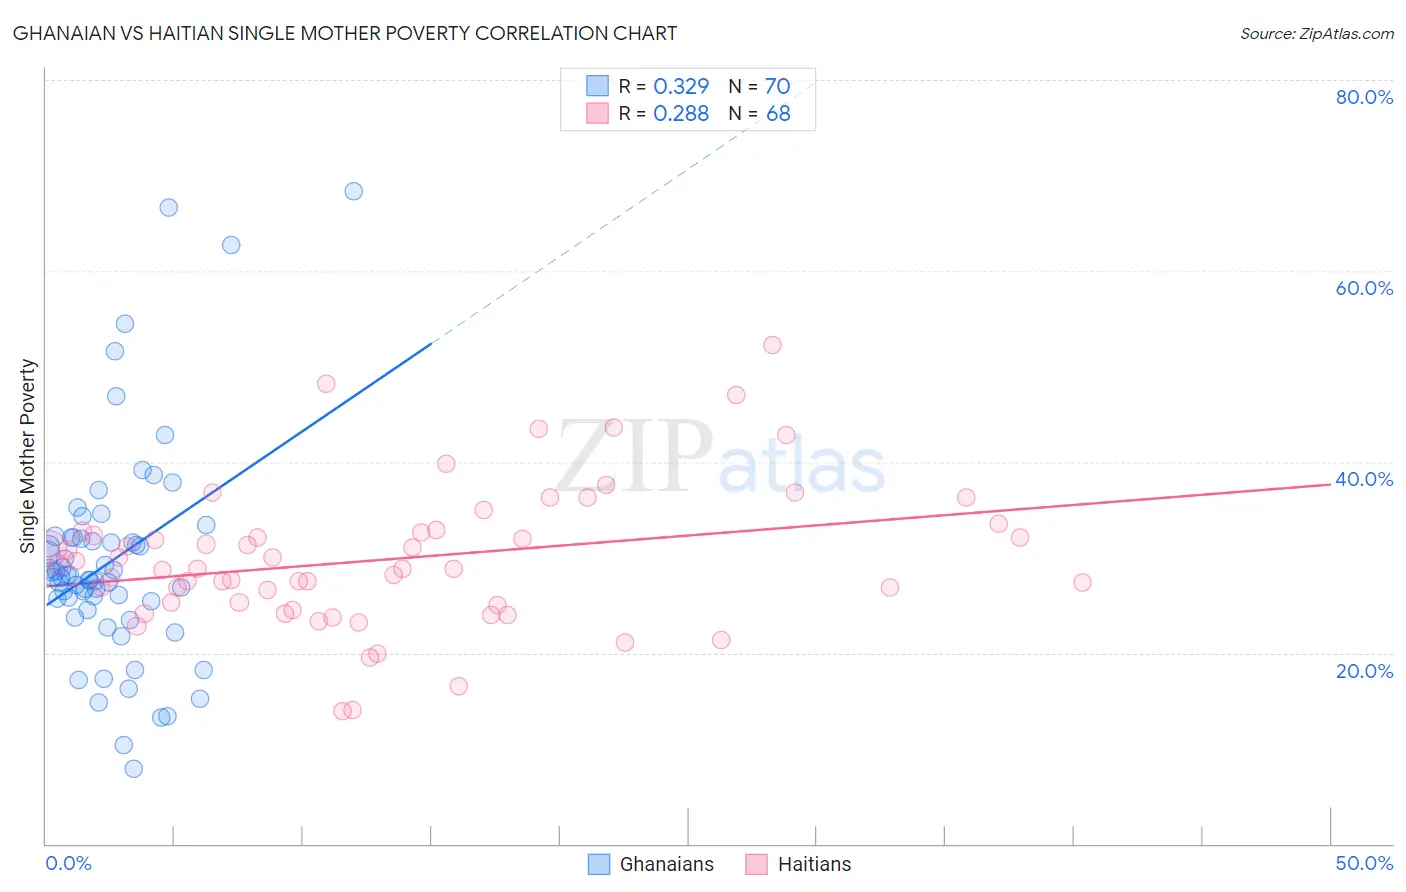
Ghanaian vs Haitian Single Mother Poverty Correlation Chart
The statistical analysis conducted on geographies consisting of 188,697,723 people shows a mild positive correlation between the proportion of Ghanaians and poverty level among single mothers in the United States with a correlation coefficient (R) of 0.329 and weighted average of 29.4%. Similarly, the statistical analysis conducted on geographies consisting of 283,035,153 people shows a weak positive correlation between the proportion of Haitians and poverty level among single mothers in the United States with a correlation coefficient (R) of 0.288 and weighted average of 29.8%, a difference of 1.6%.
Single Mother Poverty Correlation Summary
| Measurement | Ghanaian | Haitian |
| Minimum | 7.9% | 13.8% |
| Maximum | 68.3% | 52.2% |
| Range | 60.4% | 38.4% |
| Mean | 29.6% | 29.8% |
| Median | 28.0% | 28.8% |
| Interquartile 25% (IQ1) | 25.4% | 25.1% |
| Interquartile 75% (IQ3) | 32.0% | 32.7% |
| Interquartile Range (IQR) | 6.6% | 7.6% |
| Standard Deviation (Sample) | 11.4% | 7.4% |
| Standard Deviation (Population) | 11.3% | 7.4% |
Similar Demographics by Single Mother Poverty
Demographics Similar to Ghanaians by Single Mother Poverty
In terms of single mother poverty, the demographic groups most similar to Ghanaians are Yugoslavian (29.4%, a difference of 0.040%), Nigerian (29.3%, a difference of 0.060%), Nepalese (29.3%, a difference of 0.070%), Immigrants from Eastern Africa (29.3%, a difference of 0.090%), and Canadian (29.3%, a difference of 0.18%).
| Demographics | Rating | Rank | Single Mother Poverty |
| South American Indians | 43.2 /100 | #178 | Average 29.3% |
| Immigrants | Uzbekistan | 42.6 /100 | #179 | Average 29.3% |
| Immigrants | Norway | 41.5 /100 | #180 | Average 29.3% |
| Canadians | 40.4 /100 | #181 | Average 29.3% |
| Immigrants | Eastern Africa | 38.5 /100 | #182 | Fair 29.3% |
| Nepalese | 38.3 /100 | #183 | Fair 29.3% |
| Nigerians | 38.0 /100 | #184 | Fair 29.3% |
| Ghanaians | 36.8 /100 | #185 | Fair 29.4% |
| Yugoslavians | 36.0 /100 | #186 | Fair 29.4% |
| Lebanese | 32.5 /100 | #187 | Fair 29.4% |
| Guamanians/Chamorros | 31.8 /100 | #188 | Fair 29.4% |
| Immigrants | Africa | 31.6 /100 | #189 | Fair 29.4% |
| Immigrants | Germany | 30.4 /100 | #190 | Fair 29.5% |
| Immigrants | Trinidad and Tobago | 29.2 /100 | #191 | Fair 29.5% |
| Moroccans | 28.6 /100 | #192 | Fair 29.5% |
Demographics Similar to Haitians by Single Mother Poverty
In terms of single mother poverty, the demographic groups most similar to Haitians are Guyanese (29.8%, a difference of 0.050%), Irish (29.8%, a difference of 0.060%), Nicaraguan (29.8%, a difference of 0.090%), Immigrants from Guyana (29.8%, a difference of 0.14%), and Immigrants from Thailand (29.9%, a difference of 0.14%).
| Demographics | Rating | Rank | Single Mother Poverty |
| Swiss | 17.2 /100 | #203 | Poor 29.7% |
| Immigrants | Immigrants | 16.6 /100 | #204 | Poor 29.7% |
| Czechoslovakians | 16.1 /100 | #205 | Poor 29.7% |
| Immigrants | Haiti | 15.8 /100 | #206 | Poor 29.7% |
| Immigrants | Panama | 15.5 /100 | #207 | Poor 29.8% |
| Immigrants | Guyana | 14.7 /100 | #208 | Poor 29.8% |
| Irish | 13.9 /100 | #209 | Poor 29.8% |
| Haitians | 13.3 /100 | #210 | Poor 29.8% |
| Guyanese | 12.8 /100 | #211 | Poor 29.8% |
| Nicaraguans | 12.4 /100 | #212 | Poor 29.8% |
| Immigrants | Thailand | 12.0 /100 | #213 | Poor 29.9% |
| Liberians | 11.7 /100 | #214 | Poor 29.9% |
| Jamaicans | 11.7 /100 | #215 | Poor 29.9% |
| Immigrants | Western Africa | 11.5 /100 | #216 | Poor 29.9% |
| Immigrants | Ghana | 11.3 /100 | #217 | Poor 29.9% |