Ghanaian vs U.S. Virgin Islander Single Mother Poverty
COMPARE
Ghanaian
U.S. Virgin Islander
Single Mother Poverty
Single Mother Poverty Comparison
Ghanaians
U.S. Virgin Islanders
29.4%
SINGLE MOTHER POVERTY
36.8/ 100
METRIC RATING
185th/ 347
METRIC RANK
32.6%
SINGLE MOTHER POVERTY
0.0/ 100
METRIC RATING
289th/ 347
METRIC RANK
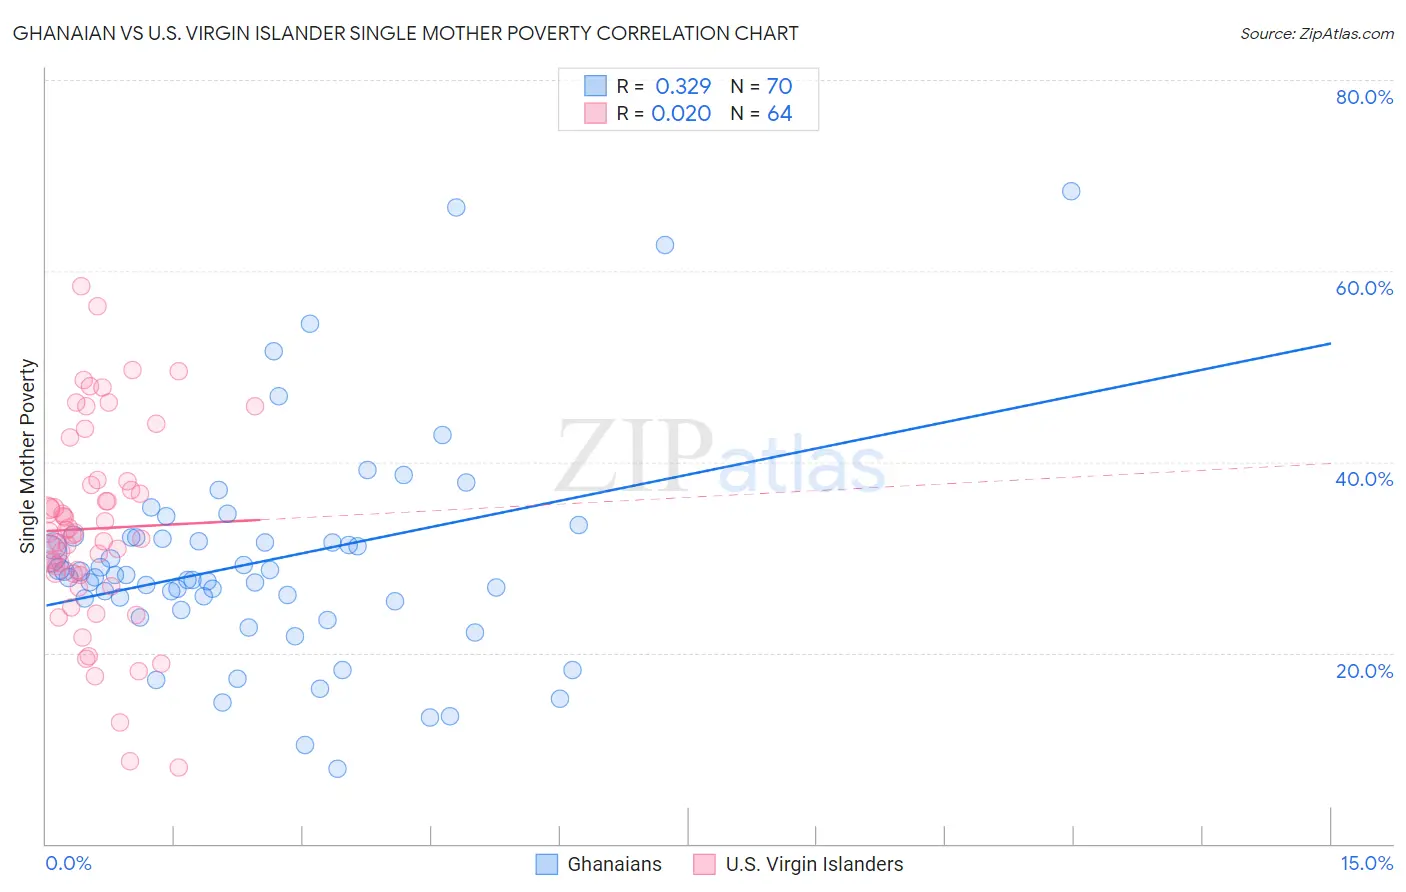
Ghanaian vs U.S. Virgin Islander Single Mother Poverty Correlation Chart
The statistical analysis conducted on geographies consisting of 188,697,723 people shows a mild positive correlation between the proportion of Ghanaians and poverty level among single mothers in the United States with a correlation coefficient (R) of 0.329 and weighted average of 29.4%. Similarly, the statistical analysis conducted on geographies consisting of 87,215,550 people shows no correlation between the proportion of U.S. Virgin Islanders and poverty level among single mothers in the United States with a correlation coefficient (R) of 0.020 and weighted average of 32.6%, a difference of 11.0%.
Single Mother Poverty Correlation Summary
| Measurement | Ghanaian | U.S. Virgin Islander |
| Minimum | 7.9% | 8.0% |
| Maximum | 68.3% | 58.4% |
| Range | 60.4% | 50.4% |
| Mean | 29.6% | 33.0% |
| Median | 28.0% | 32.4% |
| Interquartile 25% (IQ1) | 25.4% | 28.2% |
| Interquartile 75% (IQ3) | 32.0% | 37.8% |
| Interquartile Range (IQR) | 6.6% | 9.6% |
| Standard Deviation (Sample) | 11.4% | 10.5% |
| Standard Deviation (Population) | 11.3% | 10.4% |
Similar Demographics by Single Mother Poverty
Demographics Similar to Ghanaians by Single Mother Poverty
In terms of single mother poverty, the demographic groups most similar to Ghanaians are Yugoslavian (29.4%, a difference of 0.040%), Nigerian (29.3%, a difference of 0.060%), Nepalese (29.3%, a difference of 0.070%), Immigrants from Eastern Africa (29.3%, a difference of 0.090%), and Canadian (29.3%, a difference of 0.18%).
| Demographics | Rating | Rank | Single Mother Poverty |
| South American Indians | 43.2 /100 | #178 | Average 29.3% |
| Immigrants | Uzbekistan | 42.6 /100 | #179 | Average 29.3% |
| Immigrants | Norway | 41.5 /100 | #180 | Average 29.3% |
| Canadians | 40.4 /100 | #181 | Average 29.3% |
| Immigrants | Eastern Africa | 38.5 /100 | #182 | Fair 29.3% |
| Nepalese | 38.3 /100 | #183 | Fair 29.3% |
| Nigerians | 38.0 /100 | #184 | Fair 29.3% |
| Ghanaians | 36.8 /100 | #185 | Fair 29.4% |
| Yugoslavians | 36.0 /100 | #186 | Fair 29.4% |
| Lebanese | 32.5 /100 | #187 | Fair 29.4% |
| Guamanians/Chamorros | 31.8 /100 | #188 | Fair 29.4% |
| Immigrants | Africa | 31.6 /100 | #189 | Fair 29.4% |
| Immigrants | Germany | 30.4 /100 | #190 | Fair 29.5% |
| Immigrants | Trinidad and Tobago | 29.2 /100 | #191 | Fair 29.5% |
| Moroccans | 28.6 /100 | #192 | Fair 29.5% |
Demographics Similar to U.S. Virgin Islanders by Single Mother Poverty
In terms of single mother poverty, the demographic groups most similar to U.S. Virgin Islanders are Somali (32.6%, a difference of 0.030%), Osage (32.6%, a difference of 0.11%), Immigrants from Dominica (32.5%, a difference of 0.25%), Yup'ik (32.5%, a difference of 0.38%), and Immigrants from Latin America (32.4%, a difference of 0.45%).
| Demographics | Rating | Rank | Single Mother Poverty |
| Immigrants | Azores | 0.0 /100 | #282 | Tragic 32.2% |
| Spanish Americans | 0.0 /100 | #283 | Tragic 32.3% |
| Indonesians | 0.0 /100 | #284 | Tragic 32.4% |
| Immigrants | Latin America | 0.0 /100 | #285 | Tragic 32.4% |
| Yup'ik | 0.0 /100 | #286 | Tragic 32.5% |
| Immigrants | Dominica | 0.0 /100 | #287 | Tragic 32.5% |
| Somalis | 0.0 /100 | #288 | Tragic 32.6% |
| U.S. Virgin Islanders | 0.0 /100 | #289 | Tragic 32.6% |
| Osage | 0.0 /100 | #290 | Tragic 32.6% |
| Guatemalans | 0.0 /100 | #291 | Tragic 32.9% |
| Shoshone | 0.0 /100 | #292 | Tragic 32.9% |
| Aleuts | 0.0 /100 | #293 | Tragic 32.9% |
| French American Indians | 0.0 /100 | #294 | Tragic 33.1% |
| Yaqui | 0.0 /100 | #295 | Tragic 33.1% |
| Blackfeet | 0.0 /100 | #296 | Tragic 33.2% |