Colombian vs Immigrants from Honduras Single Mother Poverty
COMPARE
Colombian
Immigrants from Honduras
Single Mother Poverty
Single Mother Poverty Comparison
Colombians
Immigrants from Honduras
28.3%
SINGLE MOTHER POVERTY
91.8/ 100
METRIC RATING
122nd/ 347
METRIC RANK
34.7%
SINGLE MOTHER POVERTY
0.0/ 100
METRIC RATING
318th/ 347
METRIC RANK
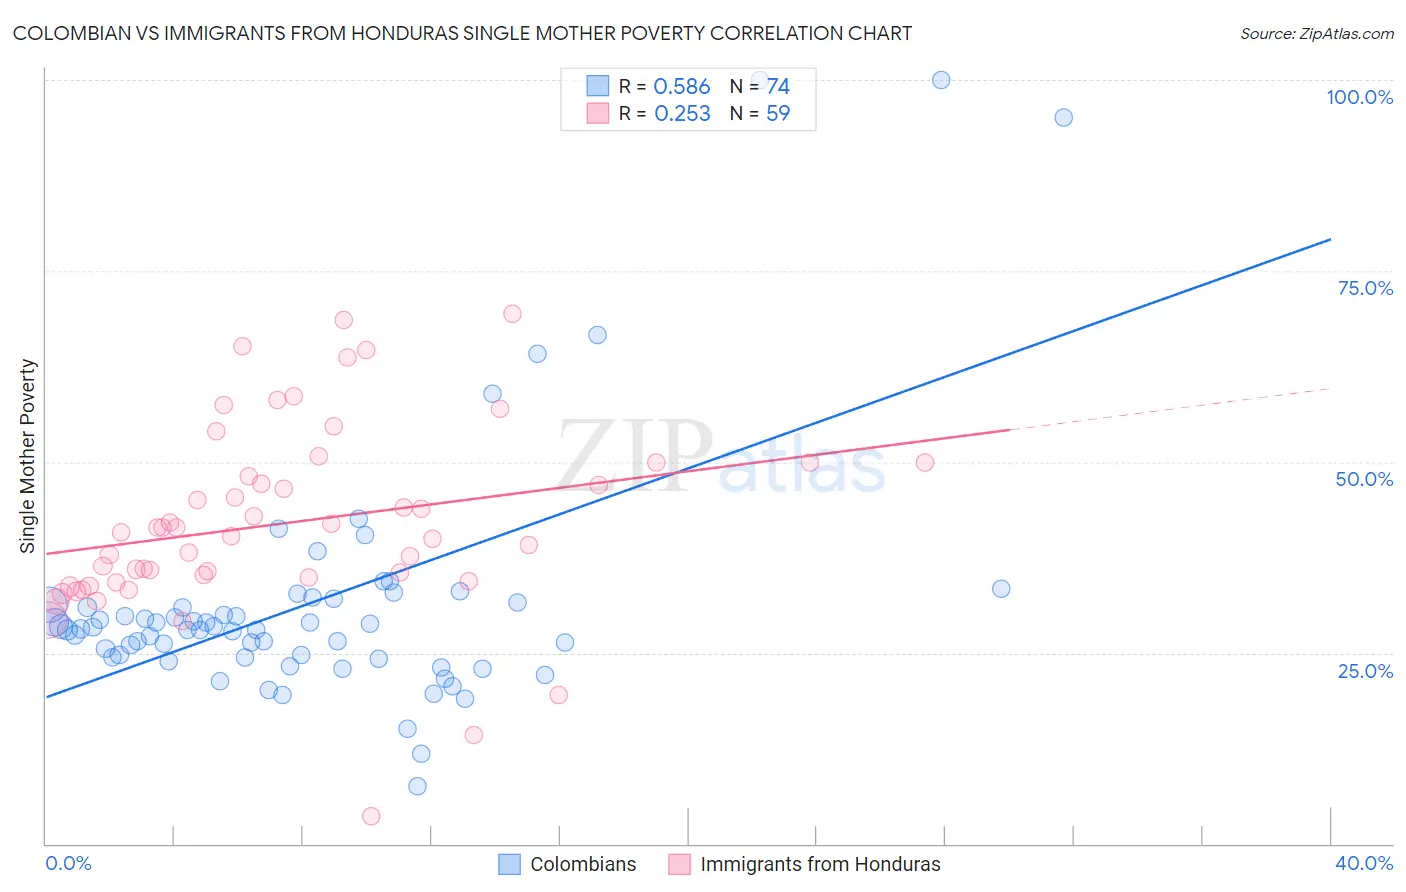
Colombian vs Immigrants from Honduras Single Mother Poverty Correlation Chart
The statistical analysis conducted on geographies consisting of 409,096,293 people shows a substantial positive correlation between the proportion of Colombians and poverty level among single mothers in the United States with a correlation coefficient (R) of 0.586 and weighted average of 28.3%. Similarly, the statistical analysis conducted on geographies consisting of 318,969,615 people shows a weak positive correlation between the proportion of Immigrants from Honduras and poverty level among single mothers in the United States with a correlation coefficient (R) of 0.253 and weighted average of 34.7%, a difference of 22.5%.
Single Mother Poverty Correlation Summary
| Measurement | Colombian | Immigrants from Honduras |
| Minimum | 7.6% | 3.6% |
| Maximum | 100.0% | 69.4% |
| Range | 92.4% | 65.9% |
| Mean | 31.7% | 42.0% |
| Median | 28.2% | 40.7% |
| Interquartile 25% (IQ1) | 24.4% | 34.3% |
| Interquartile 75% (IQ3) | 31.6% | 50.0% |
| Interquartile Range (IQR) | 7.2% | 15.7% |
| Standard Deviation (Sample) | 16.6% | 12.4% |
| Standard Deviation (Population) | 16.5% | 12.3% |
Similar Demographics by Single Mother Poverty
Demographics Similar to Colombians by Single Mother Poverty
In terms of single mother poverty, the demographic groups most similar to Colombians are Uruguayan (28.3%, a difference of 0.010%), Immigrants from Switzerland (28.3%, a difference of 0.010%), Immigrants from Afghanistan (28.3%, a difference of 0.050%), Cypriot (28.3%, a difference of 0.090%), and Immigrants from Syria (28.3%, a difference of 0.10%).
| Demographics | Rating | Rank | Single Mother Poverty |
| Immigrants | Kuwait | 92.7 /100 | #115 | Exceptional 28.3% |
| Immigrants | Uganda | 92.5 /100 | #116 | Exceptional 28.3% |
| Australians | 92.5 /100 | #117 | Exceptional 28.3% |
| Brazilians | 92.4 /100 | #118 | Exceptional 28.3% |
| Immigrants | Syria | 92.4 /100 | #119 | Exceptional 28.3% |
| Cypriots | 92.3 /100 | #120 | Exceptional 28.3% |
| Immigrants | Afghanistan | 92.1 /100 | #121 | Exceptional 28.3% |
| Colombians | 91.8 /100 | #122 | Exceptional 28.3% |
| Uruguayans | 91.7 /100 | #123 | Exceptional 28.3% |
| Immigrants | Switzerland | 91.7 /100 | #124 | Exceptional 28.3% |
| Kenyans | 90.9 /100 | #125 | Exceptional 28.4% |
| Immigrants | Chile | 90.8 /100 | #126 | Exceptional 28.4% |
| Poles | 90.8 /100 | #127 | Exceptional 28.4% |
| Immigrants | England | 90.5 /100 | #128 | Exceptional 28.4% |
| South Americans | 90.4 /100 | #129 | Exceptional 28.4% |
Demographics Similar to Immigrants from Honduras by Single Mother Poverty
In terms of single mother poverty, the demographic groups most similar to Immigrants from Honduras are Chippewa (34.8%, a difference of 0.15%), Iroquois (34.8%, a difference of 0.39%), Cherokee (34.5%, a difference of 0.52%), Dominican (34.5%, a difference of 0.63%), and Hopi (34.5%, a difference of 0.75%).
| Demographics | Rating | Rank | Single Mother Poverty |
| Alsatians | 0.0 /100 | #311 | Tragic 34.3% |
| Central American Indians | 0.0 /100 | #312 | Tragic 34.3% |
| Immigrants | Dominican Republic | 0.0 /100 | #313 | Tragic 34.4% |
| Chickasaw | 0.0 /100 | #314 | Tragic 34.4% |
| Hopi | 0.0 /100 | #315 | Tragic 34.5% |
| Dominicans | 0.0 /100 | #316 | Tragic 34.5% |
| Cherokee | 0.0 /100 | #317 | Tragic 34.5% |
| Immigrants | Honduras | 0.0 /100 | #318 | Tragic 34.7% |
| Chippewa | 0.0 /100 | #319 | Tragic 34.8% |
| Iroquois | 0.0 /100 | #320 | Tragic 34.8% |
| Paiute | 0.0 /100 | #321 | Tragic 35.1% |
| Blacks/African Americans | 0.0 /100 | #322 | Tragic 35.2% |
| Kiowa | 0.0 /100 | #323 | Tragic 35.5% |
| Ottawa | 0.0 /100 | #324 | Tragic 35.5% |
| Ute | 0.0 /100 | #325 | Tragic 35.7% |