Ghanaian vs Scottish Single Mother Poverty
COMPARE
Ghanaian
Scottish
Single Mother Poverty
Single Mother Poverty Comparison
Ghanaians
Scottish
29.4%
SINGLE MOTHER POVERTY
36.8/ 100
METRIC RATING
185th/ 347
METRIC RANK
30.1%
SINGLE MOTHER POVERTY
6.0/ 100
METRIC RATING
226th/ 347
METRIC RANK
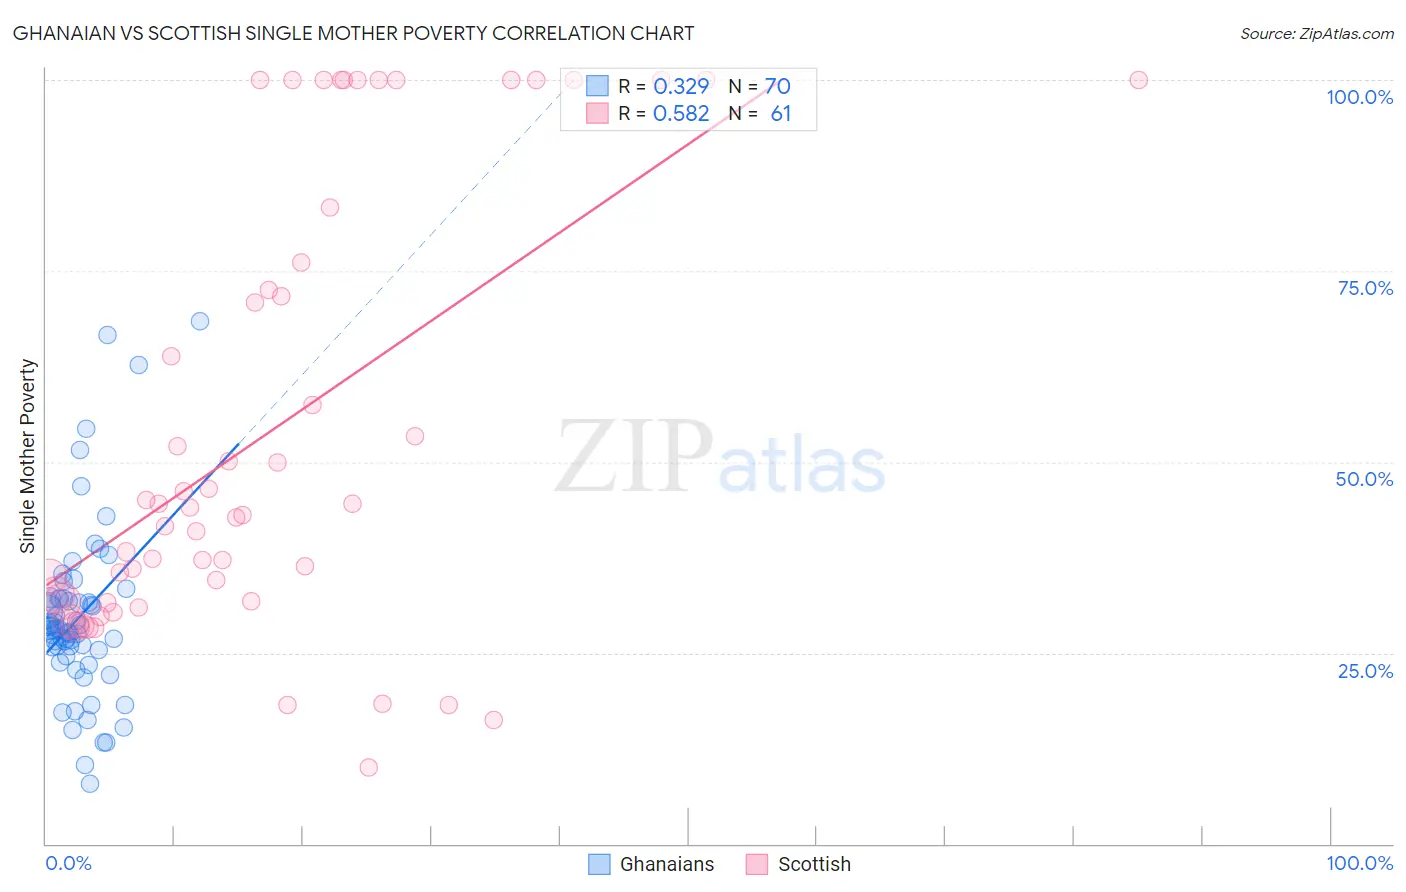
Ghanaian vs Scottish Single Mother Poverty Correlation Chart
The statistical analysis conducted on geographies consisting of 188,697,723 people shows a mild positive correlation between the proportion of Ghanaians and poverty level among single mothers in the United States with a correlation coefficient (R) of 0.329 and weighted average of 29.4%. Similarly, the statistical analysis conducted on geographies consisting of 539,065,597 people shows a substantial positive correlation between the proportion of Scottish and poverty level among single mothers in the United States with a correlation coefficient (R) of 0.582 and weighted average of 30.1%, a difference of 2.6%.
Single Mother Poverty Correlation Summary
| Measurement | Ghanaian | Scottish |
| Minimum | 7.9% | 10.0% |
| Maximum | 68.3% | 100.0% |
| Range | 60.4% | 90.0% |
| Mean | 29.6% | 54.2% |
| Median | 28.0% | 44.1% |
| Interquartile 25% (IQ1) | 25.4% | 31.8% |
| Interquartile 75% (IQ3) | 32.0% | 79.8% |
| Interquartile Range (IQR) | 6.6% | 48.0% |
| Standard Deviation (Sample) | 11.4% | 28.9% |
| Standard Deviation (Population) | 11.3% | 28.6% |
Similar Demographics by Single Mother Poverty
Demographics Similar to Ghanaians by Single Mother Poverty
In terms of single mother poverty, the demographic groups most similar to Ghanaians are Yugoslavian (29.4%, a difference of 0.040%), Nigerian (29.3%, a difference of 0.060%), Nepalese (29.3%, a difference of 0.070%), Immigrants from Eastern Africa (29.3%, a difference of 0.090%), and Canadian (29.3%, a difference of 0.18%).
| Demographics | Rating | Rank | Single Mother Poverty |
| South American Indians | 43.2 /100 | #178 | Average 29.3% |
| Immigrants | Uzbekistan | 42.6 /100 | #179 | Average 29.3% |
| Immigrants | Norway | 41.5 /100 | #180 | Average 29.3% |
| Canadians | 40.4 /100 | #181 | Average 29.3% |
| Immigrants | Eastern Africa | 38.5 /100 | #182 | Fair 29.3% |
| Nepalese | 38.3 /100 | #183 | Fair 29.3% |
| Nigerians | 38.0 /100 | #184 | Fair 29.3% |
| Ghanaians | 36.8 /100 | #185 | Fair 29.4% |
| Yugoslavians | 36.0 /100 | #186 | Fair 29.4% |
| Lebanese | 32.5 /100 | #187 | Fair 29.4% |
| Guamanians/Chamorros | 31.8 /100 | #188 | Fair 29.4% |
| Immigrants | Africa | 31.6 /100 | #189 | Fair 29.4% |
| Immigrants | Germany | 30.4 /100 | #190 | Fair 29.5% |
| Immigrants | Trinidad and Tobago | 29.2 /100 | #191 | Fair 29.5% |
| Moroccans | 28.6 /100 | #192 | Fair 29.5% |
Demographics Similar to Scottish by Single Mother Poverty
In terms of single mother poverty, the demographic groups most similar to Scottish are Immigrants from Liberia (30.1%, a difference of 0.030%), Spanish (30.1%, a difference of 0.060%), Immigrants from Sudan (30.1%, a difference of 0.090%), Spaniard (30.2%, a difference of 0.14%), and Immigrants from Cuba (30.1%, a difference of 0.16%).
| Demographics | Rating | Rank | Single Mother Poverty |
| Finns | 9.3 /100 | #219 | Tragic 30.0% |
| Germans | 8.8 /100 | #220 | Tragic 30.0% |
| Immigrants | Eritrea | 7.7 /100 | #221 | Tragic 30.0% |
| Sudanese | 7.6 /100 | #222 | Tragic 30.0% |
| Immigrants | Cuba | 6.9 /100 | #223 | Tragic 30.1% |
| Immigrants | Sudan | 6.5 /100 | #224 | Tragic 30.1% |
| Spanish | 6.3 /100 | #225 | Tragic 30.1% |
| Scottish | 6.0 /100 | #226 | Tragic 30.1% |
| Immigrants | Liberia | 5.9 /100 | #227 | Tragic 30.1% |
| Spaniards | 5.4 /100 | #228 | Tragic 30.2% |
| Immigrants | Barbados | 5.0 /100 | #229 | Tragic 30.2% |
| English | 4.8 /100 | #230 | Tragic 30.2% |
| Dutch | 4.3 /100 | #231 | Tragic 30.2% |
| Alaskan Athabascans | 4.1 /100 | #232 | Tragic 30.3% |
| Immigrants | Middle Africa | 3.5 /100 | #233 | Tragic 30.3% |