Ghanaian vs Immigrants from Honduras Householder Income Ages 45 - 64 years
COMPARE
Ghanaian
Immigrants from Honduras
Householder Income Ages 45 - 64 years
Householder Income Ages 45 - 64 years Comparison
Ghanaians
Immigrants from Honduras
$97,277
HOUSEHOLDER INCOME AGES 45 - 64 YEARS
17.9/ 100
METRIC RATING
207th/ 347
METRIC RANK
$82,697
HOUSEHOLDER INCOME AGES 45 - 64 YEARS
0.0/ 100
METRIC RATING
314th/ 347
METRIC RANK
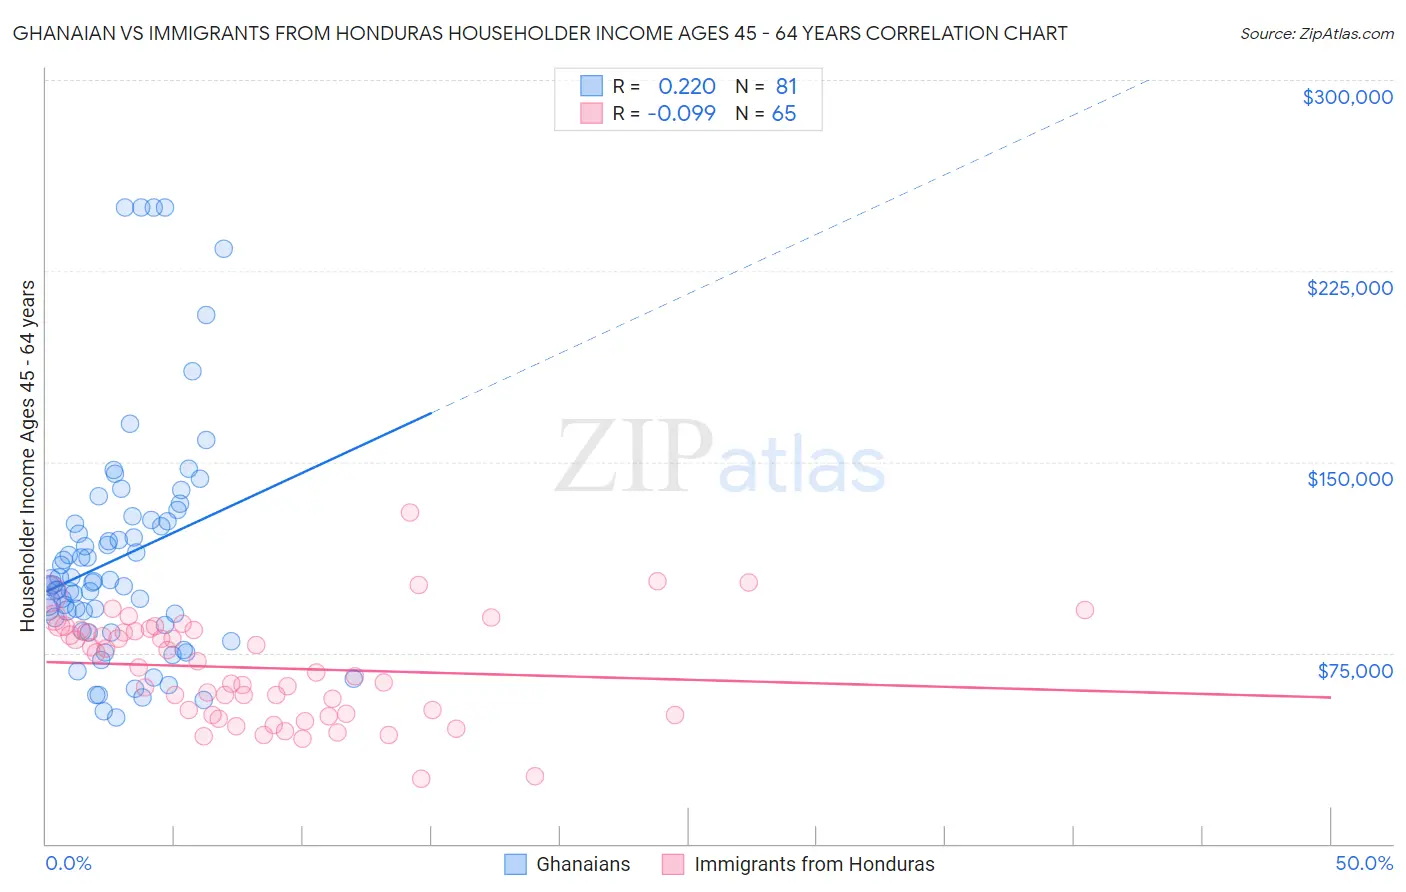
Ghanaian vs Immigrants from Honduras Householder Income Ages 45 - 64 years Correlation Chart
The statistical analysis conducted on geographies consisting of 190,434,757 people shows a weak positive correlation between the proportion of Ghanaians and household income with householder between the ages 45 and 64 in the United States with a correlation coefficient (R) of 0.220 and weighted average of $97,277. Similarly, the statistical analysis conducted on geographies consisting of 322,186,782 people shows a slight negative correlation between the proportion of Immigrants from Honduras and household income with householder between the ages 45 and 64 in the United States with a correlation coefficient (R) of -0.099 and weighted average of $82,697, a difference of 17.6%.
Householder Income Ages 45 - 64 years Correlation Summary
| Measurement | Ghanaian | Immigrants from Honduras |
| Minimum | $49,787 | $25,625 |
| Maximum | $250,001 | $130,200 |
| Range | $200,214 | $104,575 |
| Mean | $112,590 | $69,055 |
| Median | $102,711 | $69,386 |
| Interquartile 25% (IQ1) | $84,781 | $50,934 |
| Interquartile 75% (IQ3) | $126,915 | $83,889 |
| Interquartile Range (IQR) | $42,134 | $32,956 |
| Standard Deviation (Sample) | $45,701 | $20,449 |
| Standard Deviation (Population) | $45,418 | $20,291 |
Similar Demographics by Householder Income Ages 45 - 64 years
Demographics Similar to Ghanaians by Householder Income Ages 45 - 64 years
In terms of householder income ages 45 - 64 years, the demographic groups most similar to Ghanaians are Immigrants from Colombia ($97,290, a difference of 0.010%), Immigrants from Africa ($97,284, a difference of 0.010%), Immigrants from Eritrea ($97,373, a difference of 0.10%), Immigrants from Thailand ($97,400, a difference of 0.13%), and Tlingit-Haida ($97,417, a difference of 0.14%).
| Demographics | Rating | Rank | Householder Income Ages 45 - 64 years |
| Immigrants | Kenya | 23.5 /100 | #200 | Fair $97,964 |
| Yugoslavians | 20.0 /100 | #201 | Fair $97,558 |
| Tlingit-Haida | 18.9 /100 | #202 | Poor $97,417 |
| Immigrants | Thailand | 18.8 /100 | #203 | Poor $97,400 |
| Immigrants | Eritrea | 18.6 /100 | #204 | Poor $97,373 |
| Immigrants | Colombia | 18.0 /100 | #205 | Poor $97,290 |
| Immigrants | Africa | 17.9 /100 | #206 | Poor $97,284 |
| Ghanaians | 17.9 /100 | #207 | Poor $97,277 |
| Scotch-Irish | 16.4 /100 | #208 | Poor $97,073 |
| Japanese | 14.8 /100 | #209 | Poor $96,834 |
| Tsimshian | 14.5 /100 | #210 | Poor $96,783 |
| Immigrants | Cambodia | 13.0 /100 | #211 | Poor $96,537 |
| Venezuelans | 12.6 /100 | #212 | Poor $96,460 |
| Immigrants | Uruguay | 10.7 /100 | #213 | Poor $96,086 |
| Panamanians | 10.6 /100 | #214 | Poor $96,066 |
Demographics Similar to Immigrants from Honduras by Householder Income Ages 45 - 64 years
In terms of householder income ages 45 - 64 years, the demographic groups most similar to Immigrants from Honduras are U.S. Virgin Islander ($82,736, a difference of 0.050%), Paiute ($82,629, a difference of 0.080%), Immigrants from Caribbean ($82,513, a difference of 0.22%), Colville ($82,474, a difference of 0.27%), and Cajun ($83,015, a difference of 0.39%).
| Demographics | Rating | Rank | Householder Income Ages 45 - 64 years |
| Shoshone | 0.0 /100 | #307 | Tragic $83,588 |
| Immigrants | Cabo Verde | 0.0 /100 | #308 | Tragic $83,542 |
| Immigrants | Dominica | 0.0 /100 | #309 | Tragic $83,311 |
| Immigrants | Haiti | 0.0 /100 | #310 | Tragic $83,257 |
| Immigrants | Bahamas | 0.0 /100 | #311 | Tragic $83,177 |
| Cajuns | 0.0 /100 | #312 | Tragic $83,015 |
| U.S. Virgin Islanders | 0.0 /100 | #313 | Tragic $82,736 |
| Immigrants | Honduras | 0.0 /100 | #314 | Tragic $82,697 |
| Paiute | 0.0 /100 | #315 | Tragic $82,629 |
| Immigrants | Caribbean | 0.0 /100 | #316 | Tragic $82,513 |
| Colville | 0.0 /100 | #317 | Tragic $82,474 |
| Choctaw | 0.0 /100 | #318 | Tragic $82,287 |
| Chickasaw | 0.0 /100 | #319 | Tragic $82,193 |
| Apache | 0.0 /100 | #320 | Tragic $82,184 |
| Yuman | 0.0 /100 | #321 | Tragic $82,139 |