Ghanaian vs Immigrants from St. Vincent and the Grenadines Single Mother Poverty
COMPARE
Ghanaian
Immigrants from St. Vincent and the Grenadines
Single Mother Poverty
Single Mother Poverty Comparison
Ghanaians
Immigrants from St. Vincent and the Grenadines
29.4%
SINGLE MOTHER POVERTY
36.8/ 100
METRIC RATING
185th/ 347
METRIC RANK
30.4%
SINGLE MOTHER POVERTY
3.1/ 100
METRIC RATING
237th/ 347
METRIC RANK
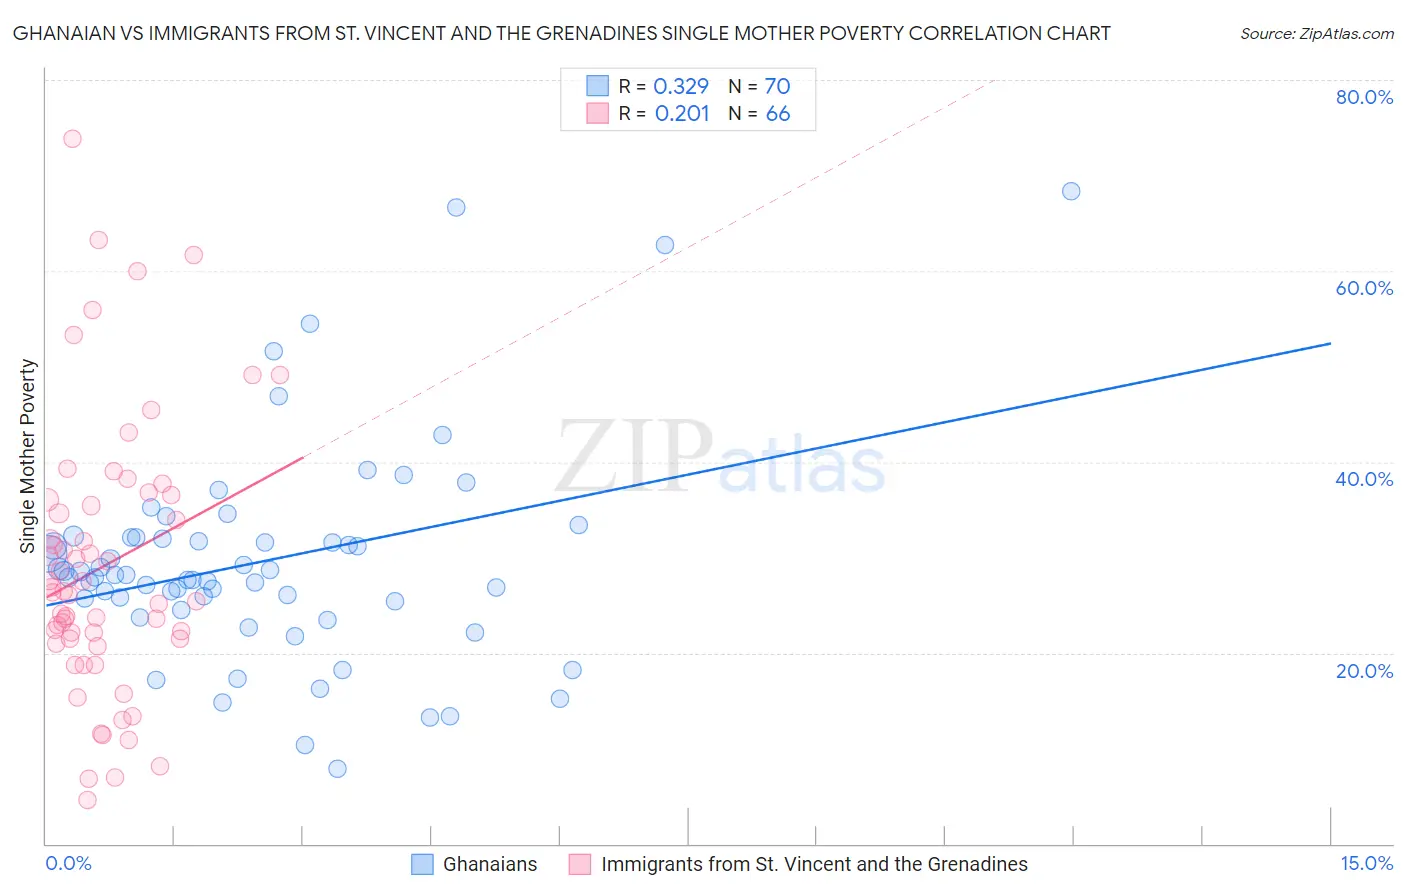
Ghanaian vs Immigrants from St. Vincent and the Grenadines Single Mother Poverty Correlation Chart
The statistical analysis conducted on geographies consisting of 188,697,723 people shows a mild positive correlation between the proportion of Ghanaians and poverty level among single mothers in the United States with a correlation coefficient (R) of 0.329 and weighted average of 29.4%. Similarly, the statistical analysis conducted on geographies consisting of 56,037,331 people shows a weak positive correlation between the proportion of Immigrants from St. Vincent and the Grenadines and poverty level among single mothers in the United States with a correlation coefficient (R) of 0.201 and weighted average of 30.4%, a difference of 3.5%.
Single Mother Poverty Correlation Summary
| Measurement | Ghanaian | Immigrants from St. Vincent and the Grenadines |
| Minimum | 7.9% | 4.6% |
| Maximum | 68.3% | 73.8% |
| Range | 60.4% | 69.1% |
| Mean | 29.6% | 29.1% |
| Median | 28.0% | 26.4% |
| Interquartile 25% (IQ1) | 25.4% | 21.5% |
| Interquartile 75% (IQ3) | 32.0% | 36.0% |
| Interquartile Range (IQR) | 6.6% | 14.5% |
| Standard Deviation (Sample) | 11.4% | 14.3% |
| Standard Deviation (Population) | 11.3% | 14.2% |
Similar Demographics by Single Mother Poverty
Demographics Similar to Ghanaians by Single Mother Poverty
In terms of single mother poverty, the demographic groups most similar to Ghanaians are Yugoslavian (29.4%, a difference of 0.040%), Nigerian (29.3%, a difference of 0.060%), Nepalese (29.3%, a difference of 0.070%), Immigrants from Eastern Africa (29.3%, a difference of 0.090%), and Canadian (29.3%, a difference of 0.18%).
| Demographics | Rating | Rank | Single Mother Poverty |
| South American Indians | 43.2 /100 | #178 | Average 29.3% |
| Immigrants | Uzbekistan | 42.6 /100 | #179 | Average 29.3% |
| Immigrants | Norway | 41.5 /100 | #180 | Average 29.3% |
| Canadians | 40.4 /100 | #181 | Average 29.3% |
| Immigrants | Eastern Africa | 38.5 /100 | #182 | Fair 29.3% |
| Nepalese | 38.3 /100 | #183 | Fair 29.3% |
| Nigerians | 38.0 /100 | #184 | Fair 29.3% |
| Ghanaians | 36.8 /100 | #185 | Fair 29.4% |
| Yugoslavians | 36.0 /100 | #186 | Fair 29.4% |
| Lebanese | 32.5 /100 | #187 | Fair 29.4% |
| Guamanians/Chamorros | 31.8 /100 | #188 | Fair 29.4% |
| Immigrants | Africa | 31.6 /100 | #189 | Fair 29.4% |
| Immigrants | Germany | 30.4 /100 | #190 | Fair 29.5% |
| Immigrants | Trinidad and Tobago | 29.2 /100 | #191 | Fair 29.5% |
| Moroccans | 28.6 /100 | #192 | Fair 29.5% |
Demographics Similar to Immigrants from St. Vincent and the Grenadines by Single Mother Poverty
In terms of single mother poverty, the demographic groups most similar to Immigrants from St. Vincent and the Grenadines are Welsh (30.4%, a difference of 0.050%), Slovak (30.4%, a difference of 0.11%), Immigrants from Grenada (30.3%, a difference of 0.12%), Immigrants from Middle Africa (30.3%, a difference of 0.14%), and Immigrants from Nicaragua (30.3%, a difference of 0.14%).
| Demographics | Rating | Rank | Single Mother Poverty |
| English | 4.8 /100 | #230 | Tragic 30.2% |
| Dutch | 4.3 /100 | #231 | Tragic 30.2% |
| Alaskan Athabascans | 4.1 /100 | #232 | Tragic 30.3% |
| Immigrants | Middle Africa | 3.5 /100 | #233 | Tragic 30.3% |
| Immigrants | Nicaragua | 3.5 /100 | #234 | Tragic 30.3% |
| Immigrants | Grenada | 3.4 /100 | #235 | Tragic 30.3% |
| Welsh | 3.2 /100 | #236 | Tragic 30.4% |
| Immigrants | St. Vincent and the Grenadines | 3.1 /100 | #237 | Tragic 30.4% |
| Slovaks | 2.8 /100 | #238 | Tragic 30.4% |
| Immigrants | Portugal | 2.1 /100 | #239 | Tragic 30.5% |
| Salvadorans | 1.8 /100 | #240 | Tragic 30.6% |
| Immigrants | Laos | 1.8 /100 | #241 | Tragic 30.6% |
| Immigrants | Burma/Myanmar | 1.7 /100 | #242 | Tragic 30.6% |
| Bermudans | 1.6 /100 | #243 | Tragic 30.6% |
| French | 1.3 /100 | #244 | Tragic 30.7% |