Ghanaian vs Immigrants from Zaire Single Mother Poverty
COMPARE
Ghanaian
Immigrants from Zaire
Single Mother Poverty
Single Mother Poverty Comparison
Ghanaians
Immigrants from Zaire
29.4%
SINGLE MOTHER POVERTY
36.8/ 100
METRIC RATING
185th/ 347
METRIC RANK
32.0%
SINGLE MOTHER POVERTY
0.0/ 100
METRIC RATING
278th/ 347
METRIC RANK
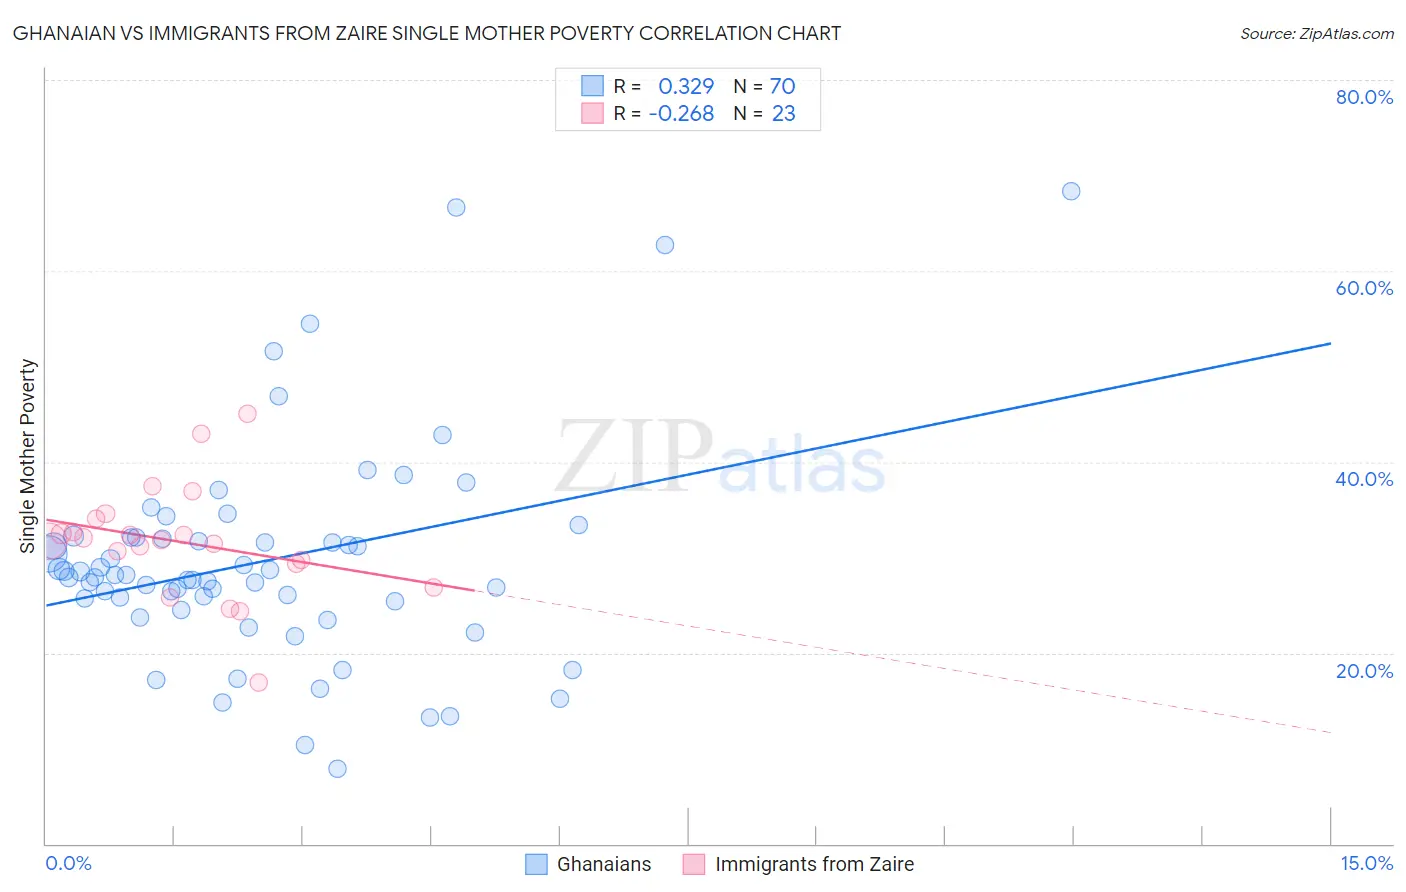
Ghanaian vs Immigrants from Zaire Single Mother Poverty Correlation Chart
The statistical analysis conducted on geographies consisting of 188,697,723 people shows a mild positive correlation between the proportion of Ghanaians and poverty level among single mothers in the United States with a correlation coefficient (R) of 0.329 and weighted average of 29.4%. Similarly, the statistical analysis conducted on geographies consisting of 106,703,532 people shows a weak negative correlation between the proportion of Immigrants from Zaire and poverty level among single mothers in the United States with a correlation coefficient (R) of -0.268 and weighted average of 32.0%, a difference of 8.9%.
Single Mother Poverty Correlation Summary
| Measurement | Ghanaian | Immigrants from Zaire |
| Minimum | 7.9% | 16.9% |
| Maximum | 68.3% | 45.1% |
| Range | 60.4% | 28.2% |
| Mean | 29.6% | 31.6% |
| Median | 28.0% | 31.9% |
| Interquartile 25% (IQ1) | 25.4% | 29.4% |
| Interquartile 75% (IQ3) | 32.0% | 34.1% |
| Interquartile Range (IQR) | 6.6% | 4.7% |
| Standard Deviation (Sample) | 11.4% | 5.9% |
| Standard Deviation (Population) | 11.3% | 5.8% |
Similar Demographics by Single Mother Poverty
Demographics Similar to Ghanaians by Single Mother Poverty
In terms of single mother poverty, the demographic groups most similar to Ghanaians are Yugoslavian (29.4%, a difference of 0.040%), Nigerian (29.3%, a difference of 0.060%), Nepalese (29.3%, a difference of 0.070%), Immigrants from Eastern Africa (29.3%, a difference of 0.090%), and Canadian (29.3%, a difference of 0.18%).
| Demographics | Rating | Rank | Single Mother Poverty |
| South American Indians | 43.2 /100 | #178 | Average 29.3% |
| Immigrants | Uzbekistan | 42.6 /100 | #179 | Average 29.3% |
| Immigrants | Norway | 41.5 /100 | #180 | Average 29.3% |
| Canadians | 40.4 /100 | #181 | Average 29.3% |
| Immigrants | Eastern Africa | 38.5 /100 | #182 | Fair 29.3% |
| Nepalese | 38.3 /100 | #183 | Fair 29.3% |
| Nigerians | 38.0 /100 | #184 | Fair 29.3% |
| Ghanaians | 36.8 /100 | #185 | Fair 29.4% |
| Yugoslavians | 36.0 /100 | #186 | Fair 29.4% |
| Lebanese | 32.5 /100 | #187 | Fair 29.4% |
| Guamanians/Chamorros | 31.8 /100 | #188 | Fair 29.4% |
| Immigrants | Africa | 31.6 /100 | #189 | Fair 29.4% |
| Immigrants | Germany | 30.4 /100 | #190 | Fair 29.5% |
| Immigrants | Trinidad and Tobago | 29.2 /100 | #191 | Fair 29.5% |
| Moroccans | 28.6 /100 | #192 | Fair 29.5% |
Demographics Similar to Immigrants from Zaire by Single Mother Poverty
In terms of single mother poverty, the demographic groups most similar to Immigrants from Zaire are Mexican American Indian (31.9%, a difference of 0.22%), Marshallese (32.1%, a difference of 0.40%), Delaware (31.8%, a difference of 0.43%), Central American (31.8%, a difference of 0.60%), and Nonimmigrants (32.2%, a difference of 0.62%).
| Demographics | Rating | Rank | Single Mother Poverty |
| Immigrants | Cabo Verde | 0.1 /100 | #271 | Tragic 31.6% |
| Immigrants | Micronesia | 0.1 /100 | #272 | Tragic 31.6% |
| Fijians | 0.1 /100 | #273 | Tragic 31.6% |
| Bangladeshis | 0.1 /100 | #274 | Tragic 31.7% |
| Central Americans | 0.1 /100 | #275 | Tragic 31.8% |
| Delaware | 0.0 /100 | #276 | Tragic 31.8% |
| Mexican American Indians | 0.0 /100 | #277 | Tragic 31.9% |
| Immigrants | Zaire | 0.0 /100 | #278 | Tragic 32.0% |
| Marshallese | 0.0 /100 | #279 | Tragic 32.1% |
| Immigrants | Nonimmigrants | 0.0 /100 | #280 | Tragic 32.2% |
| Cree | 0.0 /100 | #281 | Tragic 32.2% |
| Immigrants | Azores | 0.0 /100 | #282 | Tragic 32.2% |
| Spanish Americans | 0.0 /100 | #283 | Tragic 32.3% |
| Indonesians | 0.0 /100 | #284 | Tragic 32.4% |
| Immigrants | Latin America | 0.0 /100 | #285 | Tragic 32.4% |