Ghanaian vs Immigrants from Jamaica Single Mother Poverty
COMPARE
Ghanaian
Immigrants from Jamaica
Single Mother Poverty
Single Mother Poverty Comparison
Ghanaians
Immigrants from Jamaica
29.4%
SINGLE MOTHER POVERTY
36.8/ 100
METRIC RATING
185th/ 347
METRIC RANK
29.6%
SINGLE MOTHER POVERTY
22.0/ 100
METRIC RATING
197th/ 347
METRIC RANK
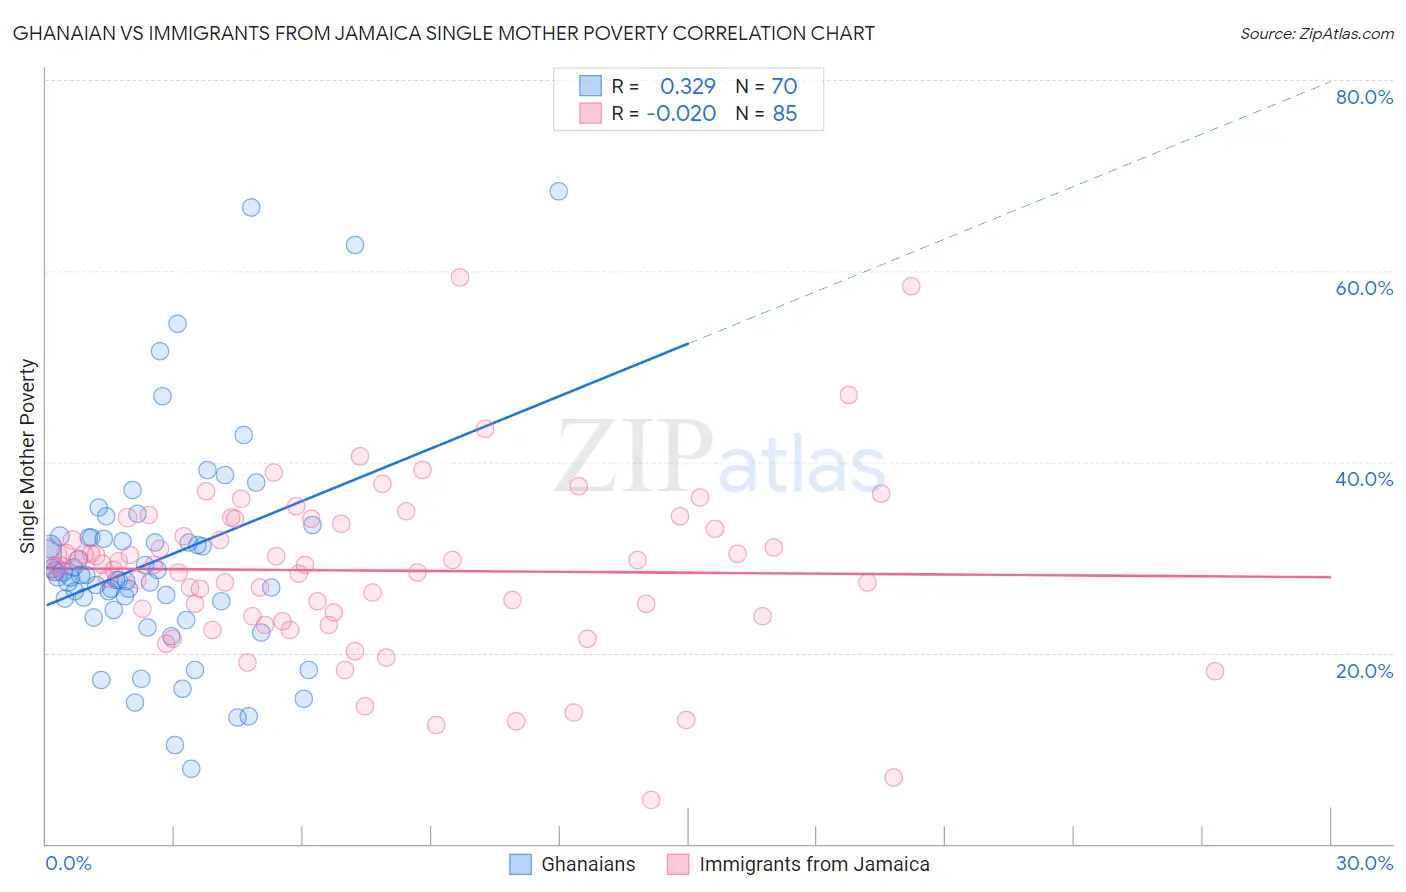
Ghanaian vs Immigrants from Jamaica Single Mother Poverty Correlation Chart
The statistical analysis conducted on geographies consisting of 188,697,723 people shows a mild positive correlation between the proportion of Ghanaians and poverty level among single mothers in the United States with a correlation coefficient (R) of 0.329 and weighted average of 29.4%. Similarly, the statistical analysis conducted on geographies consisting of 296,527,600 people shows no correlation between the proportion of Immigrants from Jamaica and poverty level among single mothers in the United States with a correlation coefficient (R) of -0.020 and weighted average of 29.6%, a difference of 0.86%.
Single Mother Poverty Correlation Summary
| Measurement | Ghanaian | Immigrants from Jamaica |
| Minimum | 7.9% | 4.6% |
| Maximum | 68.3% | 59.3% |
| Range | 60.4% | 54.7% |
| Mean | 29.6% | 28.6% |
| Median | 28.0% | 29.2% |
| Interquartile 25% (IQ1) | 25.4% | 23.9% |
| Interquartile 75% (IQ3) | 32.0% | 33.8% |
| Interquartile Range (IQR) | 6.6% | 9.9% |
| Standard Deviation (Sample) | 11.4% | 8.9% |
| Standard Deviation (Population) | 11.3% | 8.9% |
Demographics Similar to Ghanaians and Immigrants from Jamaica by Single Mother Poverty
In terms of single mother poverty, the demographic groups most similar to Ghanaians are Yugoslavian (29.4%, a difference of 0.040%), Nigerian (29.3%, a difference of 0.060%), Nepalese (29.3%, a difference of 0.070%), Immigrants from Eastern Africa (29.3%, a difference of 0.090%), and Canadian (29.3%, a difference of 0.18%). Similarly, the demographic groups most similar to Immigrants from Jamaica are Trinidadian and Tobagonian (29.6%, a difference of 0.020%), Cuban (29.6%, a difference of 0.080%), Spanish American Indian (29.6%, a difference of 0.10%), Panamanian (29.6%, a difference of 0.14%), and Slavic (29.6%, a difference of 0.17%).
| Demographics | Rating | Rank | Single Mother Poverty |
| Canadians | 40.4 /100 | #181 | Average 29.3% |
| Immigrants | Eastern Africa | 38.5 /100 | #182 | Fair 29.3% |
| Nepalese | 38.3 /100 | #183 | Fair 29.3% |
| Nigerians | 38.0 /100 | #184 | Fair 29.3% |
| Ghanaians | 36.8 /100 | #185 | Fair 29.4% |
| Yugoslavians | 36.0 /100 | #186 | Fair 29.4% |
| Lebanese | 32.5 /100 | #187 | Fair 29.4% |
| Guamanians/Chamorros | 31.8 /100 | #188 | Fair 29.4% |
| Immigrants | Africa | 31.6 /100 | #189 | Fair 29.4% |
| Immigrants | Germany | 30.4 /100 | #190 | Fair 29.5% |
| Immigrants | Trinidad and Tobago | 29.2 /100 | #191 | Fair 29.5% |
| Moroccans | 28.6 /100 | #192 | Fair 29.5% |
| Basques | 28.3 /100 | #193 | Fair 29.5% |
| Icelanders | 26.1 /100 | #194 | Fair 29.5% |
| Slavs | 24.5 /100 | #195 | Fair 29.6% |
| Spanish American Indians | 23.4 /100 | #196 | Fair 29.6% |
| Immigrants | Jamaica | 22.0 /100 | #197 | Fair 29.6% |
| Trinidadians and Tobagonians | 21.7 /100 | #198 | Fair 29.6% |
| Cubans | 20.8 /100 | #199 | Fair 29.6% |
| Panamanians | 20.0 /100 | #200 | Fair 29.6% |
| Belgians | 18.8 /100 | #201 | Poor 29.7% |