Immigrants from Eastern Africa vs Immigrants from Honduras Single Mother Poverty
COMPARE
Immigrants from Eastern Africa
Immigrants from Honduras
Single Mother Poverty
Single Mother Poverty Comparison
Immigrants from Eastern Africa
Immigrants from Honduras
29.3%
SINGLE MOTHER POVERTY
38.5/ 100
METRIC RATING
182nd/ 347
METRIC RANK
34.7%
SINGLE MOTHER POVERTY
0.0/ 100
METRIC RATING
318th/ 347
METRIC RANK
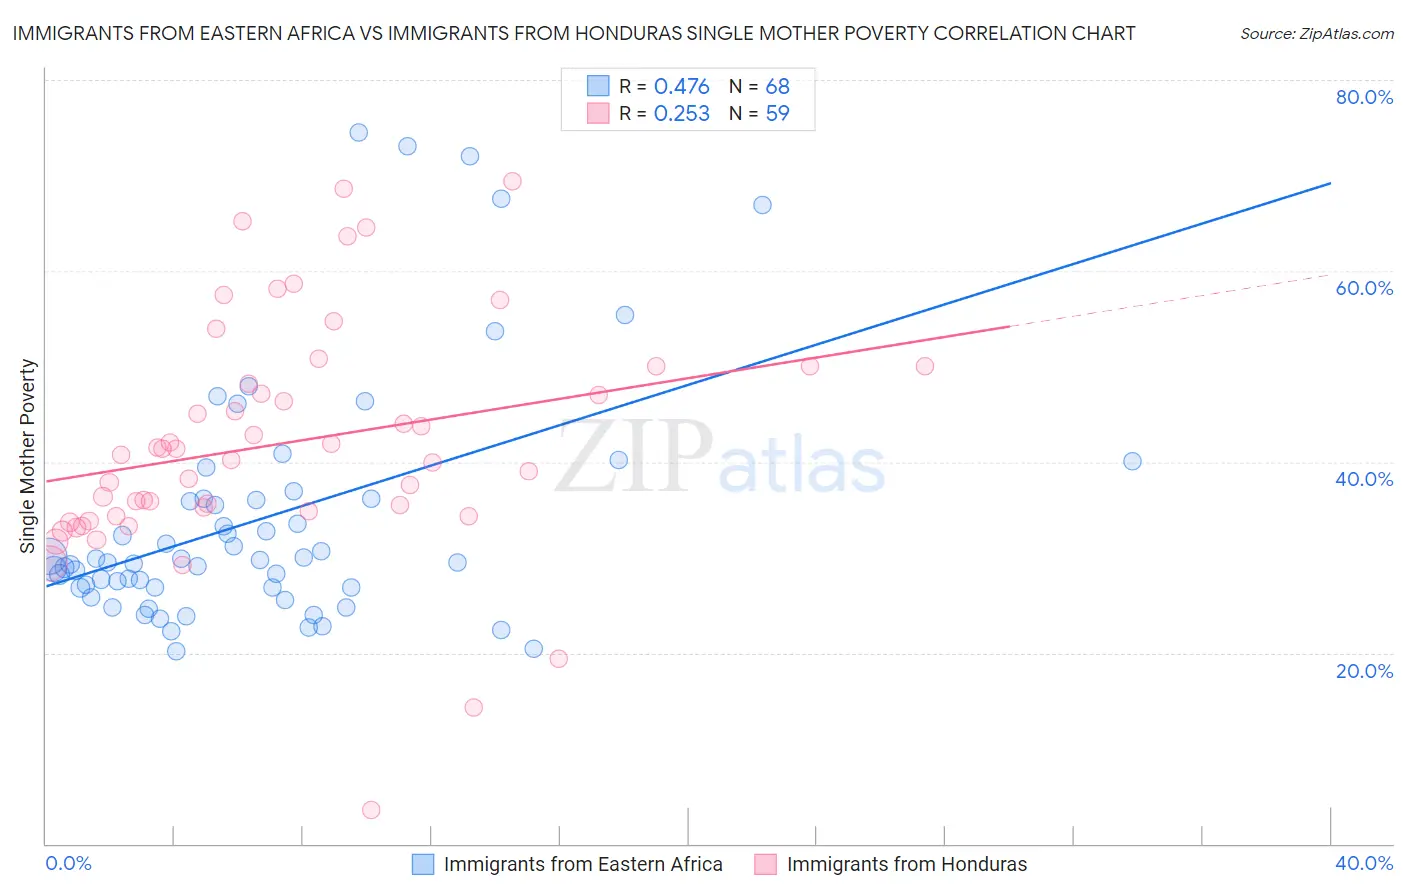
Immigrants from Eastern Africa vs Immigrants from Honduras Single Mother Poverty Correlation Chart
The statistical analysis conducted on geographies consisting of 348,777,733 people shows a moderate positive correlation between the proportion of Immigrants from Eastern Africa and poverty level among single mothers in the United States with a correlation coefficient (R) of 0.476 and weighted average of 29.3%. Similarly, the statistical analysis conducted on geographies consisting of 318,969,615 people shows a weak positive correlation between the proportion of Immigrants from Honduras and poverty level among single mothers in the United States with a correlation coefficient (R) of 0.253 and weighted average of 34.7%, a difference of 18.3%.
Single Mother Poverty Correlation Summary
| Measurement | Immigrants from Eastern Africa | Immigrants from Honduras |
| Minimum | 20.2% | 3.6% |
| Maximum | 74.6% | 69.4% |
| Range | 54.4% | 65.9% |
| Mean | 34.1% | 42.0% |
| Median | 29.5% | 40.7% |
| Interquartile 25% (IQ1) | 26.8% | 34.3% |
| Interquartile 75% (IQ3) | 36.1% | 50.0% |
| Interquartile Range (IQR) | 9.3% | 15.7% |
| Standard Deviation (Sample) | 12.8% | 12.4% |
| Standard Deviation (Population) | 12.7% | 12.3% |
Similar Demographics by Single Mother Poverty
Demographics Similar to Immigrants from Eastern Africa by Single Mother Poverty
In terms of single mother poverty, the demographic groups most similar to Immigrants from Eastern Africa are Nepalese (29.3%, a difference of 0.010%), Nigerian (29.3%, a difference of 0.030%), Canadian (29.3%, a difference of 0.090%), Ghanaian (29.4%, a difference of 0.090%), and Yugoslavian (29.4%, a difference of 0.13%).
| Demographics | Rating | Rank | Single Mother Poverty |
| Immigrants | Costa Rica | 48.8 /100 | #175 | Average 29.2% |
| Hawaiians | 47.8 /100 | #176 | Average 29.2% |
| Immigrants | Bosnia and Herzegovina | 45.1 /100 | #177 | Average 29.2% |
| South American Indians | 43.2 /100 | #178 | Average 29.3% |
| Immigrants | Uzbekistan | 42.6 /100 | #179 | Average 29.3% |
| Immigrants | Norway | 41.5 /100 | #180 | Average 29.3% |
| Canadians | 40.4 /100 | #181 | Average 29.3% |
| Immigrants | Eastern Africa | 38.5 /100 | #182 | Fair 29.3% |
| Nepalese | 38.3 /100 | #183 | Fair 29.3% |
| Nigerians | 38.0 /100 | #184 | Fair 29.3% |
| Ghanaians | 36.8 /100 | #185 | Fair 29.4% |
| Yugoslavians | 36.0 /100 | #186 | Fair 29.4% |
| Lebanese | 32.5 /100 | #187 | Fair 29.4% |
| Guamanians/Chamorros | 31.8 /100 | #188 | Fair 29.4% |
| Immigrants | Africa | 31.6 /100 | #189 | Fair 29.4% |
Demographics Similar to Immigrants from Honduras by Single Mother Poverty
In terms of single mother poverty, the demographic groups most similar to Immigrants from Honduras are Chippewa (34.8%, a difference of 0.15%), Iroquois (34.8%, a difference of 0.39%), Cherokee (34.5%, a difference of 0.52%), Dominican (34.5%, a difference of 0.63%), and Hopi (34.5%, a difference of 0.75%).
| Demographics | Rating | Rank | Single Mother Poverty |
| Alsatians | 0.0 /100 | #311 | Tragic 34.3% |
| Central American Indians | 0.0 /100 | #312 | Tragic 34.3% |
| Immigrants | Dominican Republic | 0.0 /100 | #313 | Tragic 34.4% |
| Chickasaw | 0.0 /100 | #314 | Tragic 34.4% |
| Hopi | 0.0 /100 | #315 | Tragic 34.5% |
| Dominicans | 0.0 /100 | #316 | Tragic 34.5% |
| Cherokee | 0.0 /100 | #317 | Tragic 34.5% |
| Immigrants | Honduras | 0.0 /100 | #318 | Tragic 34.7% |
| Chippewa | 0.0 /100 | #319 | Tragic 34.8% |
| Iroquois | 0.0 /100 | #320 | Tragic 34.8% |
| Paiute | 0.0 /100 | #321 | Tragic 35.1% |
| Blacks/African Americans | 0.0 /100 | #322 | Tragic 35.2% |
| Kiowa | 0.0 /100 | #323 | Tragic 35.5% |
| Ottawa | 0.0 /100 | #324 | Tragic 35.5% |
| Ute | 0.0 /100 | #325 | Tragic 35.7% |