French vs Immigrants from Sweden Single Female Poverty
COMPARE
French
Immigrants from Sweden
Single Female Poverty
Single Female Poverty Comparison
French
Immigrants from Sweden
22.2%
SINGLE FEMALE POVERTY
2.3/ 100
METRIC RATING
240th/ 347
METRIC RANK
19.4%
SINGLE FEMALE POVERTY
99.2/ 100
METRIC RATING
84th/ 347
METRIC RANK
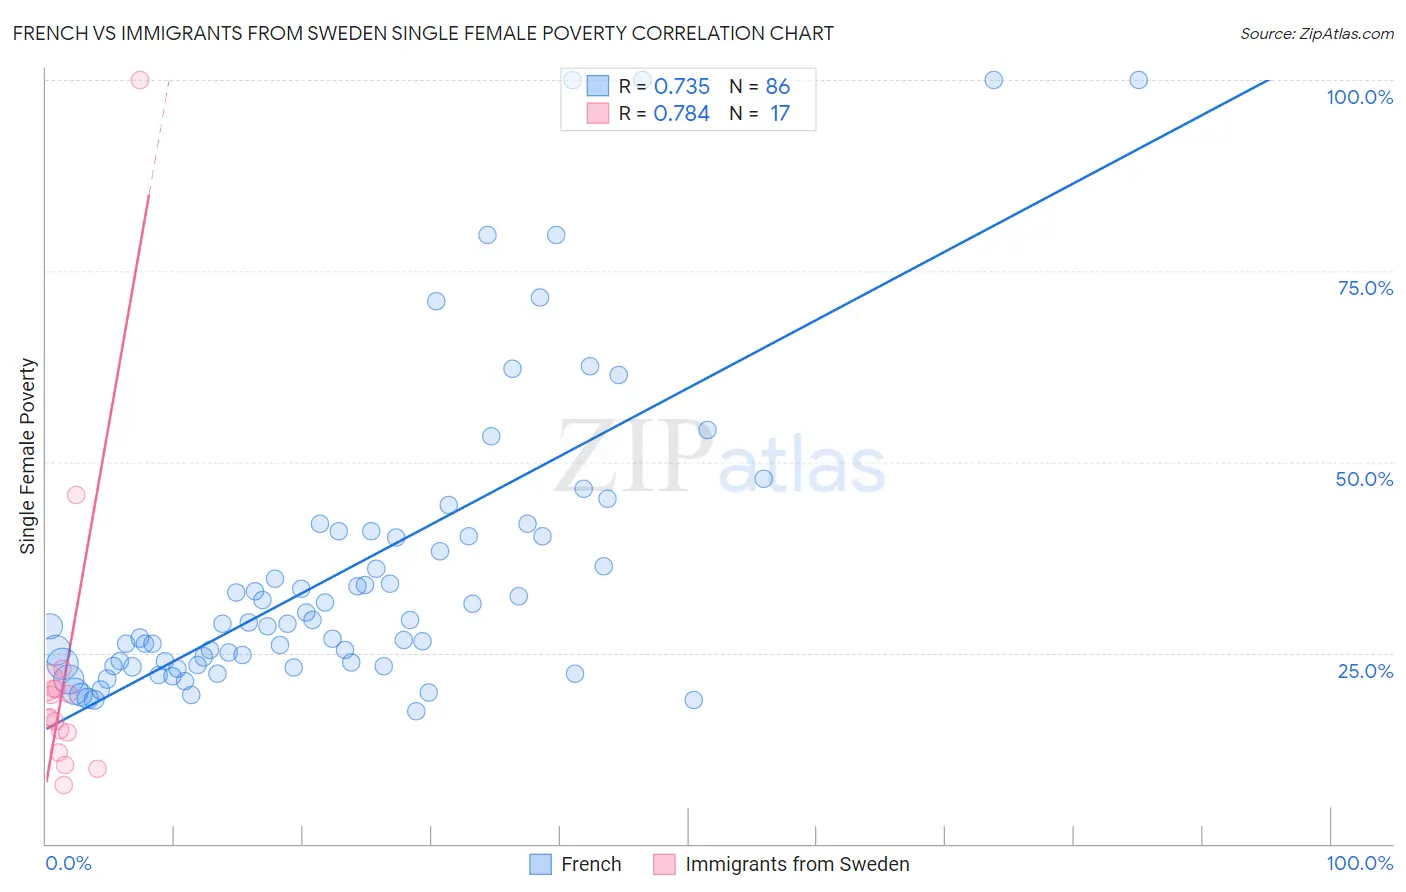
French vs Immigrants from Sweden Single Female Poverty Correlation Chart
The statistical analysis conducted on geographies consisting of 551,878,026 people shows a strong positive correlation between the proportion of French and poverty level among single females in the United States with a correlation coefficient (R) of 0.735 and weighted average of 22.2%. Similarly, the statistical analysis conducted on geographies consisting of 163,142,104 people shows a strong positive correlation between the proportion of Immigrants from Sweden and poverty level among single females in the United States with a correlation coefficient (R) of 0.784 and weighted average of 19.4%, a difference of 14.4%.
Single Female Poverty Correlation Summary
| Measurement | French | Immigrants from Sweden |
| Minimum | 17.3% | 7.8% |
| Maximum | 100.0% | 100.0% |
| Range | 82.7% | 92.2% |
| Mean | 36.0% | 22.8% |
| Median | 28.8% | 16.5% |
| Interquartile 25% (IQ1) | 23.4% | 13.2% |
| Interquartile 75% (IQ3) | 40.3% | 20.7% |
| Interquartile Range (IQR) | 17.0% | 7.5% |
| Standard Deviation (Sample) | 19.8% | 21.6% |
| Standard Deviation (Population) | 19.7% | 20.9% |
Similar Demographics by Single Female Poverty
Demographics Similar to French by Single Female Poverty
In terms of single female poverty, the demographic groups most similar to French are Cape Verdean (22.3%, a difference of 0.14%), Bermudan (22.3%, a difference of 0.21%), Malaysian (22.2%, a difference of 0.26%), French Canadian (22.2%, a difference of 0.27%), and West Indian (22.3%, a difference of 0.30%).
| Demographics | Rating | Rank | Single Female Poverty |
| Spaniards | 4.7 /100 | #233 | Tragic 22.0% |
| Spanish | 4.7 /100 | #234 | Tragic 22.0% |
| Dutch | 4.6 /100 | #235 | Tragic 22.0% |
| Immigrants | Ecuador | 4.2 /100 | #236 | Tragic 22.0% |
| Vietnamese | 4.0 /100 | #237 | Tragic 22.0% |
| French Canadians | 2.8 /100 | #238 | Tragic 22.2% |
| Malaysians | 2.8 /100 | #239 | Tragic 22.2% |
| French | 2.3 /100 | #240 | Tragic 22.2% |
| Cape Verdeans | 2.1 /100 | #241 | Tragic 22.3% |
| Bermudans | 2.0 /100 | #242 | Tragic 22.3% |
| West Indians | 1.9 /100 | #243 | Tragic 22.3% |
| Immigrants | Middle Africa | 1.9 /100 | #244 | Tragic 22.3% |
| Immigrants | Bangladesh | 1.8 /100 | #245 | Tragic 22.3% |
| Liberians | 1.4 /100 | #246 | Tragic 22.4% |
| Immigrants | El Salvador | 1.4 /100 | #247 | Tragic 22.4% |
Demographics Similar to Immigrants from Sweden by Single Female Poverty
In terms of single female poverty, the demographic groups most similar to Immigrants from Sweden are Immigrants from Albania (19.4%, a difference of 0.040%), Greek (19.4%, a difference of 0.040%), Taiwanese (19.4%, a difference of 0.080%), Immigrants from Malaysia (19.4%, a difference of 0.090%), and Immigrants from Scotland (19.4%, a difference of 0.10%).
| Demographics | Rating | Rank | Single Female Poverty |
| Immigrants | Russia | 99.3 /100 | #77 | Exceptional 19.4% |
| Albanians | 99.3 /100 | #78 | Exceptional 19.4% |
| Immigrants | Sierra Leone | 99.3 /100 | #79 | Exceptional 19.4% |
| Immigrants | Australia | 99.3 /100 | #80 | Exceptional 19.4% |
| Immigrants | Scotland | 99.2 /100 | #81 | Exceptional 19.4% |
| Immigrants | Malaysia | 99.2 /100 | #82 | Exceptional 19.4% |
| Taiwanese | 99.2 /100 | #83 | Exceptional 19.4% |
| Immigrants | Sweden | 99.2 /100 | #84 | Exceptional 19.4% |
| Immigrants | Albania | 99.2 /100 | #85 | Exceptional 19.4% |
| Greeks | 99.2 /100 | #86 | Exceptional 19.4% |
| Zimbabweans | 99.0 /100 | #87 | Exceptional 19.5% |
| Afghans | 99.0 /100 | #88 | Exceptional 19.5% |
| Immigrants | Ukraine | 99.0 /100 | #89 | Exceptional 19.5% |
| Immigrants | Lebanon | 98.8 /100 | #90 | Exceptional 19.6% |
| Soviet Union | 98.8 /100 | #91 | Exceptional 19.6% |