French Canadian vs Immigrants from France Female Unemployment
COMPARE
French Canadian
Immigrants from France
Female Unemployment
Female Unemployment Comparison
French Canadians
Immigrants from France
4.8%
FEMALE UNEMPLOYMENT
99.7/ 100
METRIC RATING
35th/ 347
METRIC RANK
5.1%
FEMALE UNEMPLOYMENT
82.7/ 100
METRIC RATING
140th/ 347
METRIC RANK
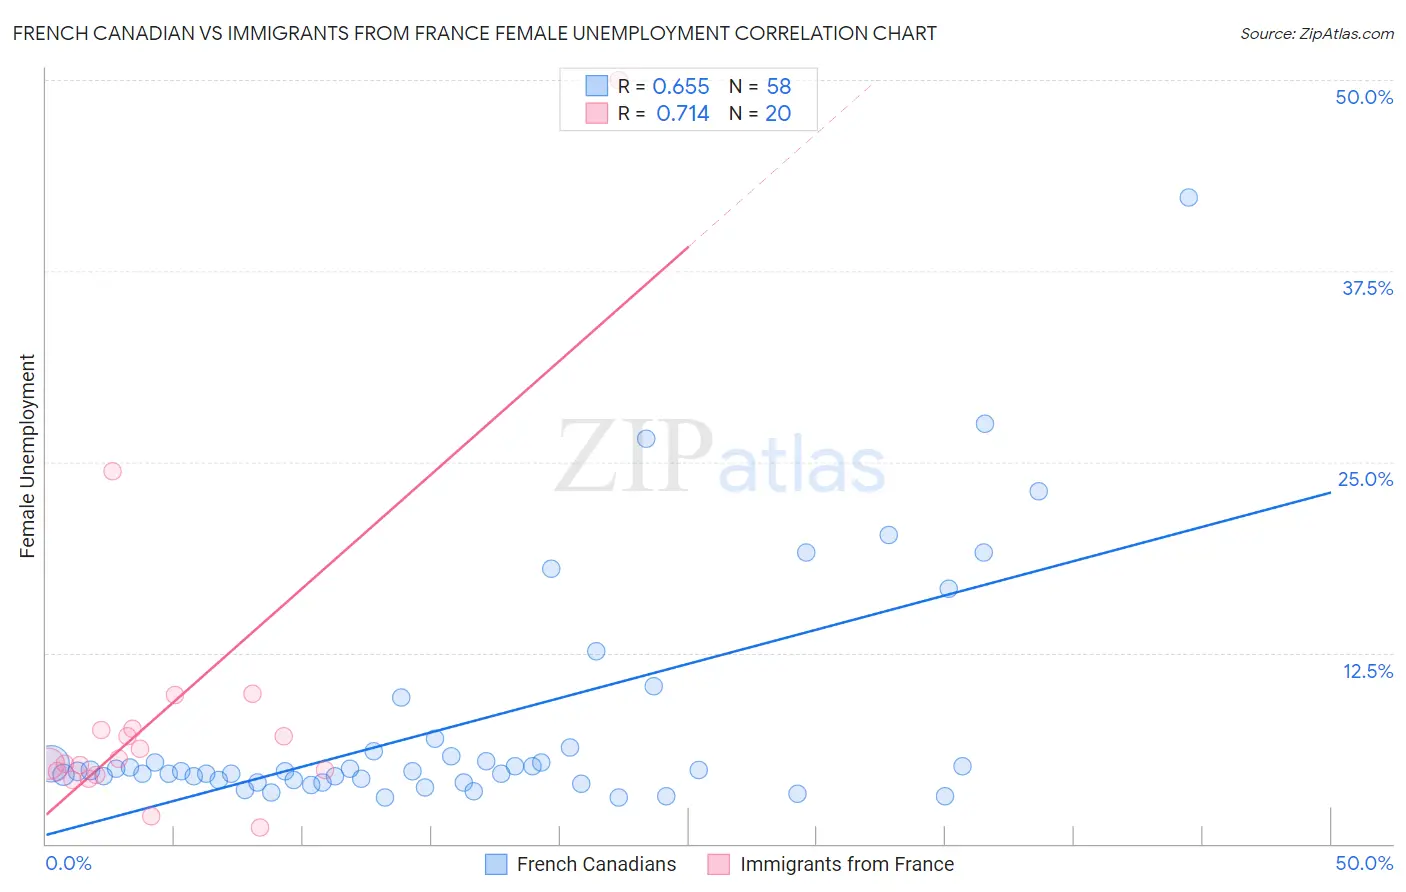
French Canadian vs Immigrants from France Female Unemployment Correlation Chart
The statistical analysis conducted on geographies consisting of 495,462,199 people shows a significant positive correlation between the proportion of French Canadians and unemploymnet rate among females in the United States with a correlation coefficient (R) of 0.655 and weighted average of 4.8%. Similarly, the statistical analysis conducted on geographies consisting of 287,167,055 people shows a strong positive correlation between the proportion of Immigrants from France and unemploymnet rate among females in the United States with a correlation coefficient (R) of 0.714 and weighted average of 5.1%, a difference of 7.1%.
Female Unemployment Correlation Summary
| Measurement | French Canadian | Immigrants from France |
| Minimum | 3.0% | 1.1% |
| Maximum | 42.3% | 50.0% |
| Range | 39.3% | 48.9% |
| Mean | 7.8% | 8.8% |
| Median | 4.7% | 5.4% |
| Interquartile 25% (IQ1) | 4.1% | 4.6% |
| Interquartile 75% (IQ3) | 6.0% | 7.5% |
| Interquartile Range (IQR) | 1.9% | 2.9% |
| Standard Deviation (Sample) | 7.6% | 10.8% |
| Standard Deviation (Population) | 7.6% | 10.5% |
Similar Demographics by Female Unemployment
Demographics Similar to French Canadians by Female Unemployment
In terms of female unemployment, the demographic groups most similar to French Canadians are Zimbabwean (4.8%, a difference of 0.060%), Czechoslovakian (4.8%, a difference of 0.10%), Yugoslavian (4.8%, a difference of 0.15%), Pennsylvania German (4.8%, a difference of 0.51%), and Slovak (4.8%, a difference of 0.61%).
| Demographics | Rating | Rank | Female Unemployment |
| Irish | 99.9 /100 | #28 | Exceptional 4.7% |
| Cypriots | 99.9 /100 | #29 | Exceptional 4.7% |
| Lithuanians | 99.8 /100 | #30 | Exceptional 4.7% |
| Sudanese | 99.8 /100 | #31 | Exceptional 4.8% |
| Slovaks | 99.8 /100 | #32 | Exceptional 4.8% |
| Czechoslovakians | 99.7 /100 | #33 | Exceptional 4.8% |
| Zimbabweans | 99.7 /100 | #34 | Exceptional 4.8% |
| French Canadians | 99.7 /100 | #35 | Exceptional 4.8% |
| Yugoslavians | 99.7 /100 | #36 | Exceptional 4.8% |
| Pennsylvania Germans | 99.6 /100 | #37 | Exceptional 4.8% |
| Northern Europeans | 99.6 /100 | #38 | Exceptional 4.8% |
| Scotch-Irish | 99.6 /100 | #39 | Exceptional 4.8% |
| French | 99.6 /100 | #40 | Exceptional 4.8% |
| Tongans | 99.5 /100 | #41 | Exceptional 4.8% |
| Italians | 99.5 /100 | #42 | Exceptional 4.8% |
Demographics Similar to Immigrants from France by Female Unemployment
In terms of female unemployment, the demographic groups most similar to Immigrants from France are Immigrants from Eastern Asia (5.1%, a difference of 0.040%), Chickasaw (5.1%, a difference of 0.060%), Immigrants from Eastern Europe (5.1%, a difference of 0.12%), Pakistani (5.1%, a difference of 0.13%), and Indian (Asian) (5.1%, a difference of 0.17%).
| Demographics | Rating | Rank | Female Unemployment |
| Immigrants | Hong Kong | 84.8 /100 | #133 | Excellent 5.1% |
| Immigrants | Eritrea | 84.6 /100 | #134 | Excellent 5.1% |
| Immigrants | Latvia | 84.6 /100 | #135 | Excellent 5.1% |
| Indians (Asian) | 84.2 /100 | #136 | Excellent 5.1% |
| Pakistanis | 83.8 /100 | #137 | Excellent 5.1% |
| Chickasaw | 83.2 /100 | #138 | Excellent 5.1% |
| Immigrants | Eastern Asia | 83.0 /100 | #139 | Excellent 5.1% |
| Immigrants | France | 82.7 /100 | #140 | Excellent 5.1% |
| Immigrants | Eastern Europe | 81.5 /100 | #141 | Excellent 5.1% |
| Palestinians | 80.8 /100 | #142 | Excellent 5.1% |
| Immigrants | Kazakhstan | 80.7 /100 | #143 | Excellent 5.1% |
| Immigrants | Jordan | 80.4 /100 | #144 | Excellent 5.1% |
| Immigrants | Oceania | 79.5 /100 | #145 | Good 5.2% |
| Immigrants | Norway | 79.4 /100 | #146 | Good 5.2% |
| Argentineans | 79.2 /100 | #147 | Good 5.2% |