French Canadian vs Immigrants from France Master's Degree
COMPARE
French Canadian
Immigrants from France
Master's Degree
Master's Degree Comparison
French Canadians
Immigrants from France
14.1%
MASTER'S DEGREE
14.9/ 100
METRIC RATING
218th/ 347
METRIC RANK
20.3%
MASTER'S DEGREE
100.0/ 100
METRIC RATING
23rd/ 347
METRIC RANK
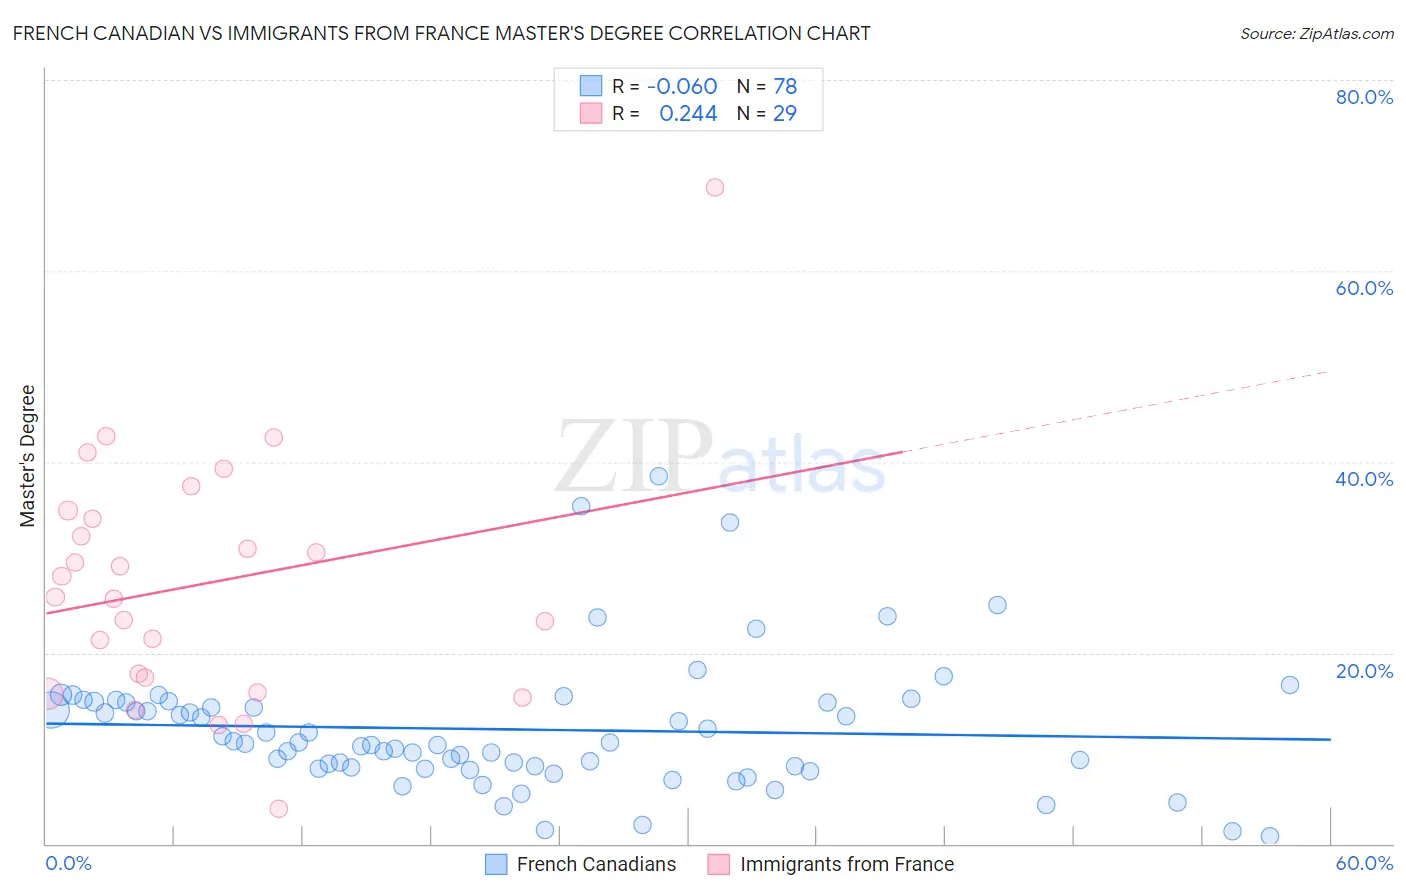
French Canadian vs Immigrants from France Master's Degree Correlation Chart
The statistical analysis conducted on geographies consisting of 502,359,495 people shows a slight negative correlation between the proportion of French Canadians and percentage of population with at least master's degree education in the United States with a correlation coefficient (R) of -0.060 and weighted average of 14.1%. Similarly, the statistical analysis conducted on geographies consisting of 287,872,995 people shows a weak positive correlation between the proportion of Immigrants from France and percentage of population with at least master's degree education in the United States with a correlation coefficient (R) of 0.244 and weighted average of 20.3%, a difference of 44.0%.
Master's Degree Correlation Summary
| Measurement | French Canadian | Immigrants from France |
| Minimum | 0.81% | 3.7% |
| Maximum | 38.5% | 68.8% |
| Range | 37.6% | 65.0% |
| Mean | 12.0% | 27.1% |
| Median | 10.6% | 25.8% |
| Interquartile 25% (IQ1) | 8.0% | 16.6% |
| Interquartile 75% (IQ3) | 14.9% | 34.4% |
| Interquartile Range (IQR) | 6.9% | 17.8% |
| Standard Deviation (Sample) | 6.9% | 12.9% |
| Standard Deviation (Population) | 6.9% | 12.7% |
Similar Demographics by Master's Degree
Demographics Similar to French Canadians by Master's Degree
In terms of master's degree, the demographic groups most similar to French Canadians are Immigrants from Somalia (14.1%, a difference of 0.25%), Immigrants from Trinidad and Tobago (14.1%, a difference of 0.25%), Immigrants from Vietnam (14.1%, a difference of 0.32%), Norwegian (14.0%, a difference of 0.35%), and German (14.0%, a difference of 0.50%).
| Demographics | Rating | Rank | Master's Degree |
| Somalis | 18.0 /100 | #211 | Poor 14.2% |
| Spanish | 17.8 /100 | #212 | Poor 14.2% |
| Immigrants | Thailand | 17.0 /100 | #213 | Poor 14.2% |
| Finns | 16.9 /100 | #214 | Poor 14.2% |
| Immigrants | Vietnam | 16.1 /100 | #215 | Poor 14.1% |
| Immigrants | Somalia | 15.8 /100 | #216 | Poor 14.1% |
| Immigrants | Trinidad and Tobago | 15.8 /100 | #217 | Poor 14.1% |
| French Canadians | 14.9 /100 | #218 | Poor 14.1% |
| Norwegians | 13.6 /100 | #219 | Poor 14.0% |
| Germans | 13.1 /100 | #220 | Poor 14.0% |
| Koreans | 12.7 /100 | #221 | Poor 14.0% |
| Ecuadorians | 12.6 /100 | #222 | Poor 14.0% |
| Immigrants | South Eastern Asia | 11.9 /100 | #223 | Poor 14.0% |
| Immigrants | Grenada | 11.8 /100 | #224 | Poor 14.0% |
| Portuguese | 11.2 /100 | #225 | Poor 13.9% |
Demographics Similar to Immigrants from France by Master's Degree
In terms of master's degree, the demographic groups most similar to Immigrants from France are Immigrants from Sweden (20.3%, a difference of 0.070%), Israeli (20.3%, a difference of 0.28%), Immigrants from Ireland (20.4%, a difference of 0.70%), Indian (Asian) (20.5%, a difference of 0.81%), and Immigrants from Hong Kong (20.5%, a difference of 0.83%).
| Demographics | Rating | Rank | Master's Degree |
| Immigrants | Belgium | 100.0 /100 | #16 | Exceptional 20.8% |
| Immigrants | South Central Asia | 100.0 /100 | #17 | Exceptional 20.7% |
| Soviet Union | 100.0 /100 | #18 | Exceptional 20.5% |
| Immigrants | Hong Kong | 100.0 /100 | #19 | Exceptional 20.5% |
| Indians (Asian) | 100.0 /100 | #20 | Exceptional 20.5% |
| Immigrants | Ireland | 100.0 /100 | #21 | Exceptional 20.4% |
| Israelis | 100.0 /100 | #22 | Exceptional 20.3% |
| Immigrants | France | 100.0 /100 | #23 | Exceptional 20.3% |
| Immigrants | Sweden | 100.0 /100 | #24 | Exceptional 20.3% |
| Immigrants | Japan | 100.0 /100 | #25 | Exceptional 20.0% |
| Cambodians | 100.0 /100 | #26 | Exceptional 20.0% |
| Immigrants | Sri Lanka | 100.0 /100 | #27 | Exceptional 19.9% |
| Turks | 100.0 /100 | #28 | Exceptional 19.9% |
| Latvians | 100.0 /100 | #29 | Exceptional 19.8% |
| Immigrants | Turkey | 100.0 /100 | #30 | Exceptional 19.7% |