Immigrants from Europe vs Yugoslavian Receiving Food Stamps
COMPARE
Immigrants from Europe
Yugoslavian
Receiving Food Stamps
Receiving Food Stamps Comparison
Immigrants from Europe
Yugoslavians
10.3%
RECEIVING FOOD STAMPS
96.8/ 100
METRIC RATING
102nd/ 347
METRIC RANK
10.7%
RECEIVING FOOD STAMPS
92.5/ 100
METRIC RATING
129th/ 347
METRIC RANK
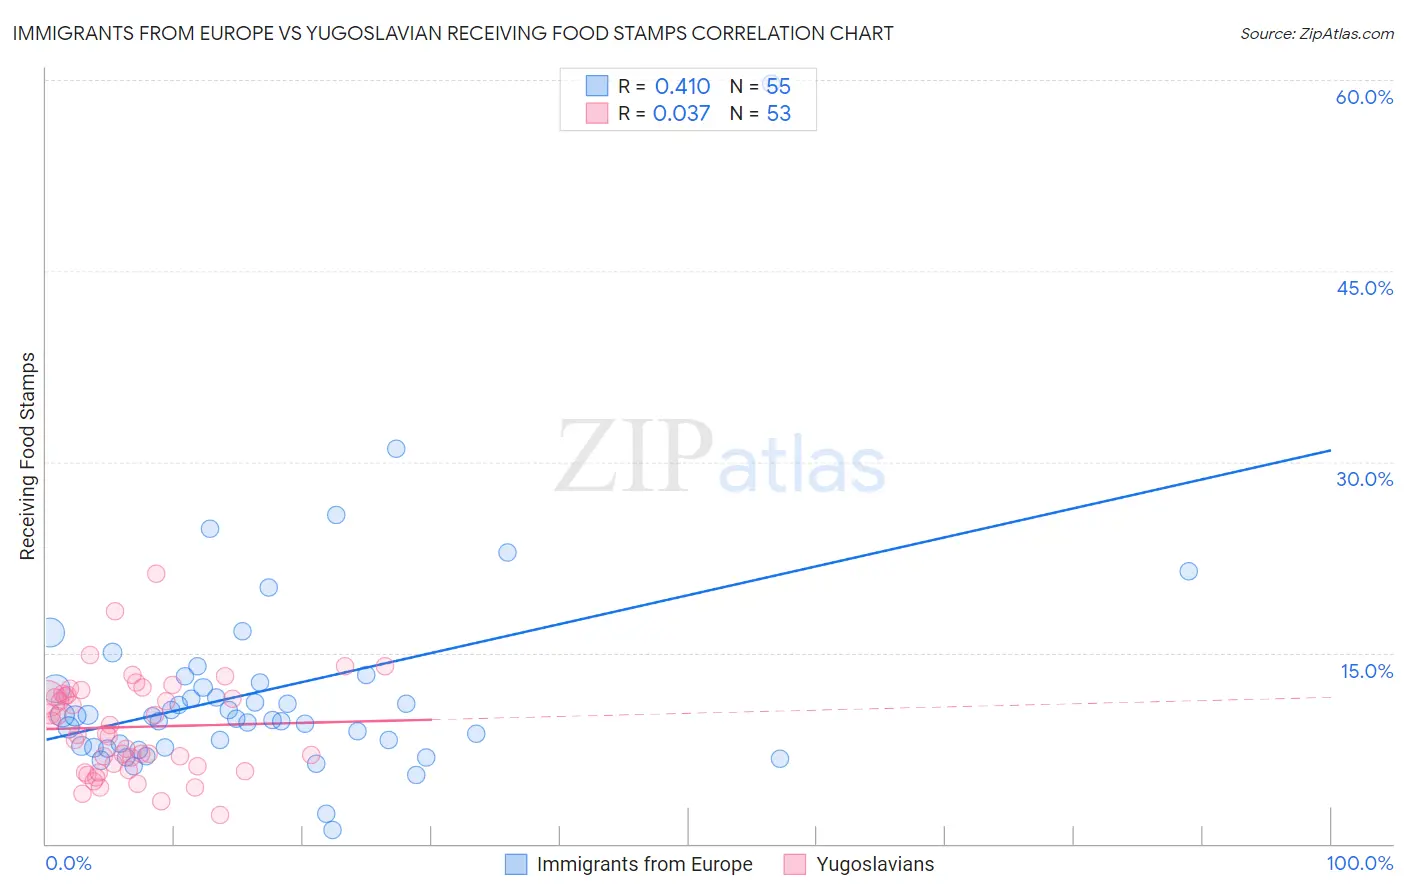
Immigrants from Europe vs Yugoslavian Receiving Food Stamps Correlation Chart
The statistical analysis conducted on geographies consisting of 544,262,616 people shows a moderate positive correlation between the proportion of Immigrants from Europe and percentage of population receiving government assistance and/or food stamps in the United States with a correlation coefficient (R) of 0.410 and weighted average of 10.3%. Similarly, the statistical analysis conducted on geographies consisting of 285,227,567 people shows no correlation between the proportion of Yugoslavians and percentage of population receiving government assistance and/or food stamps in the United States with a correlation coefficient (R) of 0.037 and weighted average of 10.7%, a difference of 3.6%.
Receiving Food Stamps Correlation Summary
| Measurement | Immigrants from Europe | Yugoslavian |
| Minimum | 1.1% | 2.3% |
| Maximum | 59.7% | 21.2% |
| Range | 58.6% | 18.9% |
| Mean | 12.0% | 9.2% |
| Median | 10.0% | 8.6% |
| Interquartile 25% (IQ1) | 7.6% | 5.9% |
| Interquartile 75% (IQ3) | 12.7% | 11.7% |
| Interquartile Range (IQR) | 5.1% | 5.8% |
| Standard Deviation (Sample) | 8.6% | 3.8% |
| Standard Deviation (Population) | 8.5% | 3.8% |
Similar Demographics by Receiving Food Stamps
Demographics Similar to Immigrants from Europe by Receiving Food Stamps
In terms of receiving food stamps, the demographic groups most similar to Immigrants from Europe are Immigrants from Western Europe (10.3%, a difference of 0.090%), Palestinian (10.3%, a difference of 0.090%), Immigrants from Latvia (10.3%, a difference of 0.10%), Immigrants from Hungary (10.3%, a difference of 0.11%), and Serbian (10.3%, a difference of 0.21%).
| Demographics | Rating | Rank | Receiving Food Stamps |
| Basques | 97.4 /100 | #95 | Exceptional 10.3% |
| Welsh | 97.3 /100 | #96 | Exceptional 10.3% |
| Czechoslovakians | 97.2 /100 | #97 | Exceptional 10.3% |
| Immigrants | Egypt | 97.1 /100 | #98 | Exceptional 10.3% |
| Serbians | 97.0 /100 | #99 | Exceptional 10.3% |
| Immigrants | Western Europe | 96.9 /100 | #100 | Exceptional 10.3% |
| Palestinians | 96.9 /100 | #101 | Exceptional 10.3% |
| Immigrants | Europe | 96.8 /100 | #102 | Exceptional 10.3% |
| Immigrants | Latvia | 96.8 /100 | #103 | Exceptional 10.3% |
| Immigrants | Hungary | 96.7 /100 | #104 | Exceptional 10.3% |
| Immigrants | Malaysia | 96.5 /100 | #105 | Exceptional 10.4% |
| Immigrants | Italy | 96.4 /100 | #106 | Exceptional 10.4% |
| Koreans | 96.3 /100 | #107 | Exceptional 10.4% |
| Carpatho Rusyns | 96.2 /100 | #108 | Exceptional 10.4% |
| Immigrants | Pakistan | 96.2 /100 | #109 | Exceptional 10.4% |
Demographics Similar to Yugoslavians by Receiving Food Stamps
In terms of receiving food stamps, the demographic groups most similar to Yugoslavians are Immigrants from Jordan (10.7%, a difference of 0.0%), Immigrants from Ethiopia (10.7%, a difference of 0.010%), Afghan (10.7%, a difference of 0.030%), Israeli (10.7%, a difference of 0.10%), and French (10.7%, a difference of 0.10%).
| Demographics | Rating | Rank | Receiving Food Stamps |
| Sri Lankans | 93.7 /100 | #122 | Exceptional 10.6% |
| Immigrants | Philippines | 93.3 /100 | #123 | Exceptional 10.7% |
| Paraguayans | 93.0 /100 | #124 | Exceptional 10.7% |
| Ukrainians | 92.8 /100 | #125 | Exceptional 10.7% |
| Afghans | 92.6 /100 | #126 | Exceptional 10.7% |
| Immigrants | Ethiopia | 92.6 /100 | #127 | Exceptional 10.7% |
| Immigrants | Jordan | 92.5 /100 | #128 | Exceptional 10.7% |
| Yugoslavians | 92.5 /100 | #129 | Exceptional 10.7% |
| Israelis | 92.4 /100 | #130 | Exceptional 10.7% |
| French | 92.3 /100 | #131 | Exceptional 10.7% |
| Immigrants | Germany | 92.0 /100 | #132 | Exceptional 10.7% |
| Immigrants | Russia | 90.9 /100 | #133 | Exceptional 10.8% |
| Immigrants | Brazil | 90.3 /100 | #134 | Exceptional 10.8% |
| Argentineans | 90.2 /100 | #135 | Exceptional 10.8% |
| Slovaks | 89.8 /100 | #136 | Excellent 10.8% |