Finnish vs Yugoslavian Unemployment Among Ages 35 to 44 years
COMPARE
Finnish
Yugoslavian
Unemployment Among Ages 35 to 44 years
Unemployment Among Ages 35 to 44 years Comparison
Finns
Yugoslavians
4.5%
UNEMPLOYMENT AMONG AGES 35 TO 44 YEARS
91.6/ 100
METRIC RATING
104th/ 347
METRIC RANK
4.5%
UNEMPLOYMENT AMONG AGES 35 TO 44 YEARS
93.6/ 100
METRIC RATING
95th/ 347
METRIC RANK
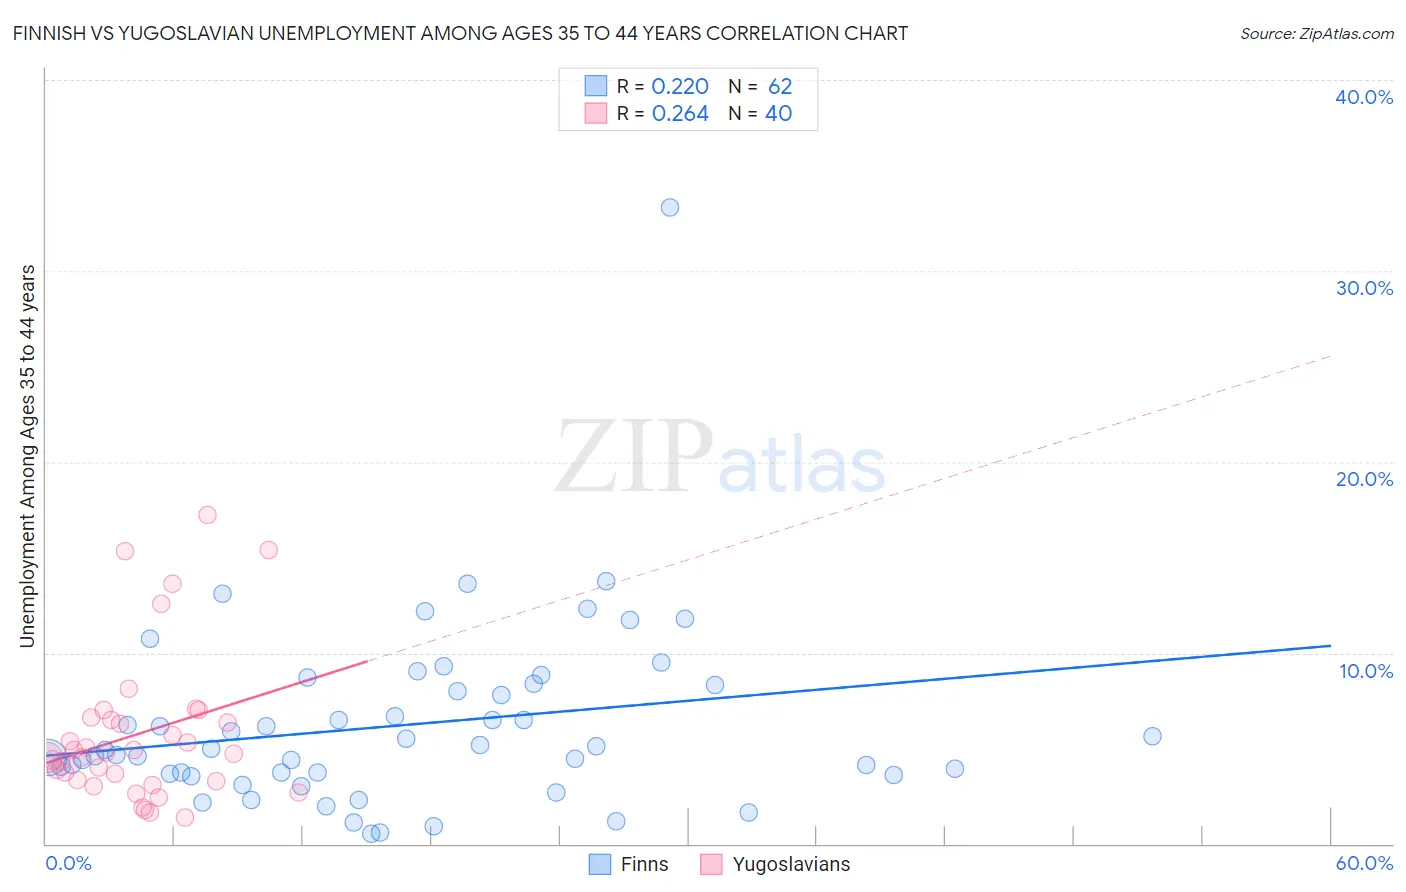
Finnish vs Yugoslavian Unemployment Among Ages 35 to 44 years Correlation Chart
The statistical analysis conducted on geographies consisting of 391,570,263 people shows a weak positive correlation between the proportion of Finns and unemployment rate among population between the ages 35 and 44 in the United States with a correlation coefficient (R) of 0.220 and weighted average of 4.5%. Similarly, the statistical analysis conducted on geographies consisting of 280,789,871 people shows a weak positive correlation between the proportion of Yugoslavians and unemployment rate among population between the ages 35 and 44 in the United States with a correlation coefficient (R) of 0.264 and weighted average of 4.5%, a difference of 0.57%.
Unemployment Among Ages 35 to 44 years Correlation Summary
| Measurement | Finnish | Yugoslavian |
| Minimum | 0.50% | 1.4% |
| Maximum | 33.3% | 17.2% |
| Range | 32.8% | 15.8% |
| Mean | 6.2% | 5.7% |
| Median | 4.9% | 4.7% |
| Interquartile 25% (IQ1) | 3.7% | 3.3% |
| Interquartile 75% (IQ3) | 8.3% | 6.5% |
| Interquartile Range (IQR) | 4.6% | 3.2% |
| Standard Deviation (Sample) | 4.9% | 3.9% |
| Standard Deviation (Population) | 4.8% | 3.8% |
Demographics Similar to Finns and Yugoslavians by Unemployment Among Ages 35 to 44 years
In terms of unemployment among ages 35 to 44 years, the demographic groups most similar to Finns are Welsh (4.5%, a difference of 0.020%), Immigrants from Sudan (4.5%, a difference of 0.050%), Immigrants from Saudi Arabia (4.5%, a difference of 0.060%), Immigrants from Netherlands (4.5%, a difference of 0.070%), and Italian (4.5%, a difference of 0.090%). Similarly, the demographic groups most similar to Yugoslavians are Russian (4.5%, a difference of 0.040%), Scottish (4.5%, a difference of 0.040%), Iranian (4.5%, a difference of 0.090%), Estonian (4.5%, a difference of 0.21%), and Immigrants from Northern Europe (4.5%, a difference of 0.22%).
| Demographics | Rating | Rank | Unemployment Among Ages 35 to 44 years |
| Egyptians | 94.5 /100 | #89 | Exceptional 4.5% |
| Australians | 94.5 /100 | #90 | Exceptional 4.5% |
| Immigrants | Northern Europe | 94.3 /100 | #91 | Exceptional 4.5% |
| Estonians | 94.3 /100 | #92 | Exceptional 4.5% |
| Iranians | 93.9 /100 | #93 | Exceptional 4.5% |
| Russians | 93.8 /100 | #94 | Exceptional 4.5% |
| Yugoslavians | 93.6 /100 | #95 | Exceptional 4.5% |
| Scottish | 93.5 /100 | #96 | Exceptional 4.5% |
| Immigrants | France | 92.5 /100 | #97 | Exceptional 4.5% |
| Immigrants | Canada | 92.3 /100 | #98 | Exceptional 4.5% |
| Immigrants | Egypt | 92.3 /100 | #99 | Exceptional 4.5% |
| Italians | 91.9 /100 | #100 | Exceptional 4.5% |
| Immigrants | Netherlands | 91.9 /100 | #101 | Exceptional 4.5% |
| Immigrants | Sudan | 91.8 /100 | #102 | Exceptional 4.5% |
| Welsh | 91.6 /100 | #103 | Exceptional 4.5% |
| Finns | 91.6 /100 | #104 | Exceptional 4.5% |
| Immigrants | Saudi Arabia | 91.3 /100 | #105 | Exceptional 4.5% |
| Immigrants | North America | 91.1 /100 | #106 | Exceptional 4.5% |
| Immigrants | North Macedonia | 90.7 /100 | #107 | Exceptional 4.5% |
| New Zealanders | 90.3 /100 | #108 | Exceptional 4.5% |
| Romanians | 90.3 /100 | #109 | Exceptional 4.5% |