Fijian vs Yugoslavian Receiving Food Stamps
COMPARE
Fijian
Yugoslavian
Receiving Food Stamps
Receiving Food Stamps Comparison
Fijians
Yugoslavians
13.0%
RECEIVING FOOD STAMPS
4.3/ 100
METRIC RATING
225th/ 347
METRIC RANK
10.7%
RECEIVING FOOD STAMPS
92.5/ 100
METRIC RATING
129th/ 347
METRIC RANK
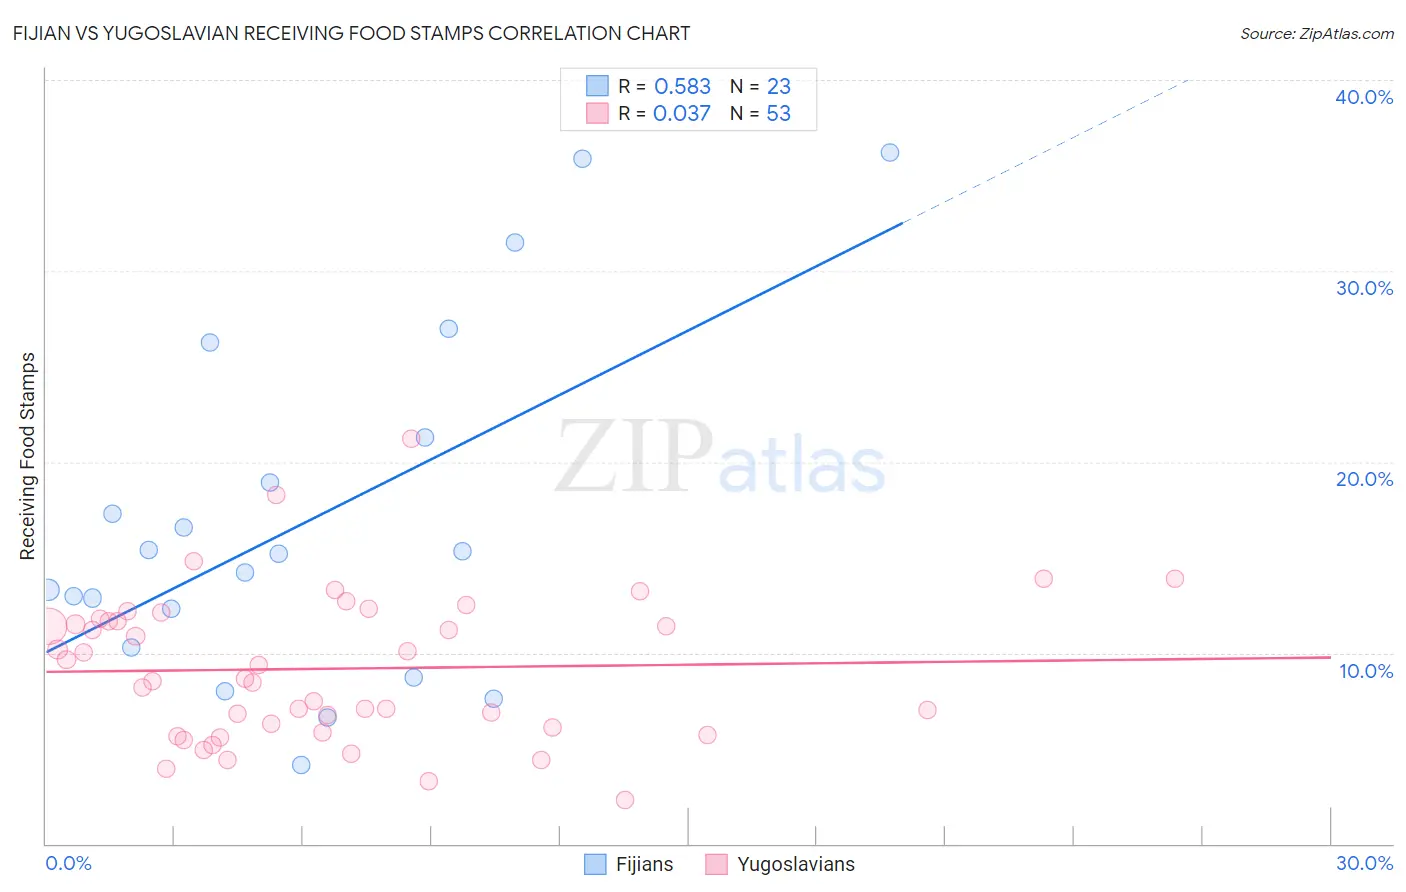
Fijian vs Yugoslavian Receiving Food Stamps Correlation Chart
The statistical analysis conducted on geographies consisting of 55,945,460 people shows a substantial positive correlation between the proportion of Fijians and percentage of population receiving government assistance and/or food stamps in the United States with a correlation coefficient (R) of 0.583 and weighted average of 13.0%. Similarly, the statistical analysis conducted on geographies consisting of 285,227,567 people shows no correlation between the proportion of Yugoslavians and percentage of population receiving government assistance and/or food stamps in the United States with a correlation coefficient (R) of 0.037 and weighted average of 10.7%, a difference of 21.6%.
Receiving Food Stamps Correlation Summary
| Measurement | Fijian | Yugoslavian |
| Minimum | 4.1% | 2.3% |
| Maximum | 36.2% | 21.2% |
| Range | 32.1% | 18.9% |
| Mean | 16.9% | 9.2% |
| Median | 15.2% | 8.6% |
| Interquartile 25% (IQ1) | 10.3% | 5.9% |
| Interquartile 75% (IQ3) | 21.3% | 11.7% |
| Interquartile Range (IQR) | 11.0% | 5.8% |
| Standard Deviation (Sample) | 9.0% | 3.8% |
| Standard Deviation (Population) | 8.8% | 3.8% |
Similar Demographics by Receiving Food Stamps
Demographics Similar to Fijians by Receiving Food Stamps
In terms of receiving food stamps, the demographic groups most similar to Fijians are Immigrants from Armenia (13.0%, a difference of 0.020%), Immigrants from Albania (13.0%, a difference of 0.090%), Immigrants (13.0%, a difference of 0.13%), Bermudan (13.0%, a difference of 0.39%), and Chickasaw (13.1%, a difference of 0.60%).
| Demographics | Rating | Rank | Receiving Food Stamps |
| Hawaiians | 5.4 /100 | #218 | Tragic 12.9% |
| Immigrants | Middle Africa | 5.4 /100 | #219 | Tragic 12.9% |
| Immigrants | Colombia | 5.3 /100 | #220 | Tragic 12.9% |
| Bermudans | 4.8 /100 | #221 | Tragic 13.0% |
| Immigrants | Immigrants | 4.4 /100 | #222 | Tragic 13.0% |
| Immigrants | Albania | 4.4 /100 | #223 | Tragic 13.0% |
| Immigrants | Armenia | 4.3 /100 | #224 | Tragic 13.0% |
| Fijians | 4.3 /100 | #225 | Tragic 13.0% |
| Chickasaw | 3.6 /100 | #226 | Tragic 13.1% |
| Nigerians | 3.5 /100 | #227 | Tragic 13.1% |
| Panamanians | 3.5 /100 | #228 | Tragic 13.1% |
| Ottawa | 3.5 /100 | #229 | Tragic 13.1% |
| Puget Sound Salish | 3.4 /100 | #230 | Tragic 13.1% |
| Immigrants | Nigeria | 3.4 /100 | #231 | Tragic 13.1% |
| Salvadorans | 2.7 /100 | #232 | Tragic 13.2% |
Demographics Similar to Yugoslavians by Receiving Food Stamps
In terms of receiving food stamps, the demographic groups most similar to Yugoslavians are Immigrants from Jordan (10.7%, a difference of 0.0%), Immigrants from Ethiopia (10.7%, a difference of 0.010%), Afghan (10.7%, a difference of 0.030%), Israeli (10.7%, a difference of 0.10%), and French (10.7%, a difference of 0.10%).
| Demographics | Rating | Rank | Receiving Food Stamps |
| Sri Lankans | 93.7 /100 | #122 | Exceptional 10.6% |
| Immigrants | Philippines | 93.3 /100 | #123 | Exceptional 10.7% |
| Paraguayans | 93.0 /100 | #124 | Exceptional 10.7% |
| Ukrainians | 92.8 /100 | #125 | Exceptional 10.7% |
| Afghans | 92.6 /100 | #126 | Exceptional 10.7% |
| Immigrants | Ethiopia | 92.6 /100 | #127 | Exceptional 10.7% |
| Immigrants | Jordan | 92.5 /100 | #128 | Exceptional 10.7% |
| Yugoslavians | 92.5 /100 | #129 | Exceptional 10.7% |
| Israelis | 92.4 /100 | #130 | Exceptional 10.7% |
| French | 92.3 /100 | #131 | Exceptional 10.7% |
| Immigrants | Germany | 92.0 /100 | #132 | Exceptional 10.7% |
| Immigrants | Russia | 90.9 /100 | #133 | Exceptional 10.8% |
| Immigrants | Brazil | 90.3 /100 | #134 | Exceptional 10.8% |
| Argentineans | 90.2 /100 | #135 | Exceptional 10.8% |
| Slovaks | 89.8 /100 | #136 | Excellent 10.8% |