Ethiopian vs Uruguayan Births to Unmarried Women
COMPARE
Ethiopian
Uruguayan
Births to Unmarried Women
Births to Unmarried Women Comparison
Ethiopians
Uruguayans
29.8%
BIRTHS TO UNMARRIED WOMEN
91.9/ 100
METRIC RATING
115th/ 347
METRIC RANK
33.1%
BIRTHS TO UNMARRIED WOMEN
12.8/ 100
METRIC RATING
206th/ 347
METRIC RANK
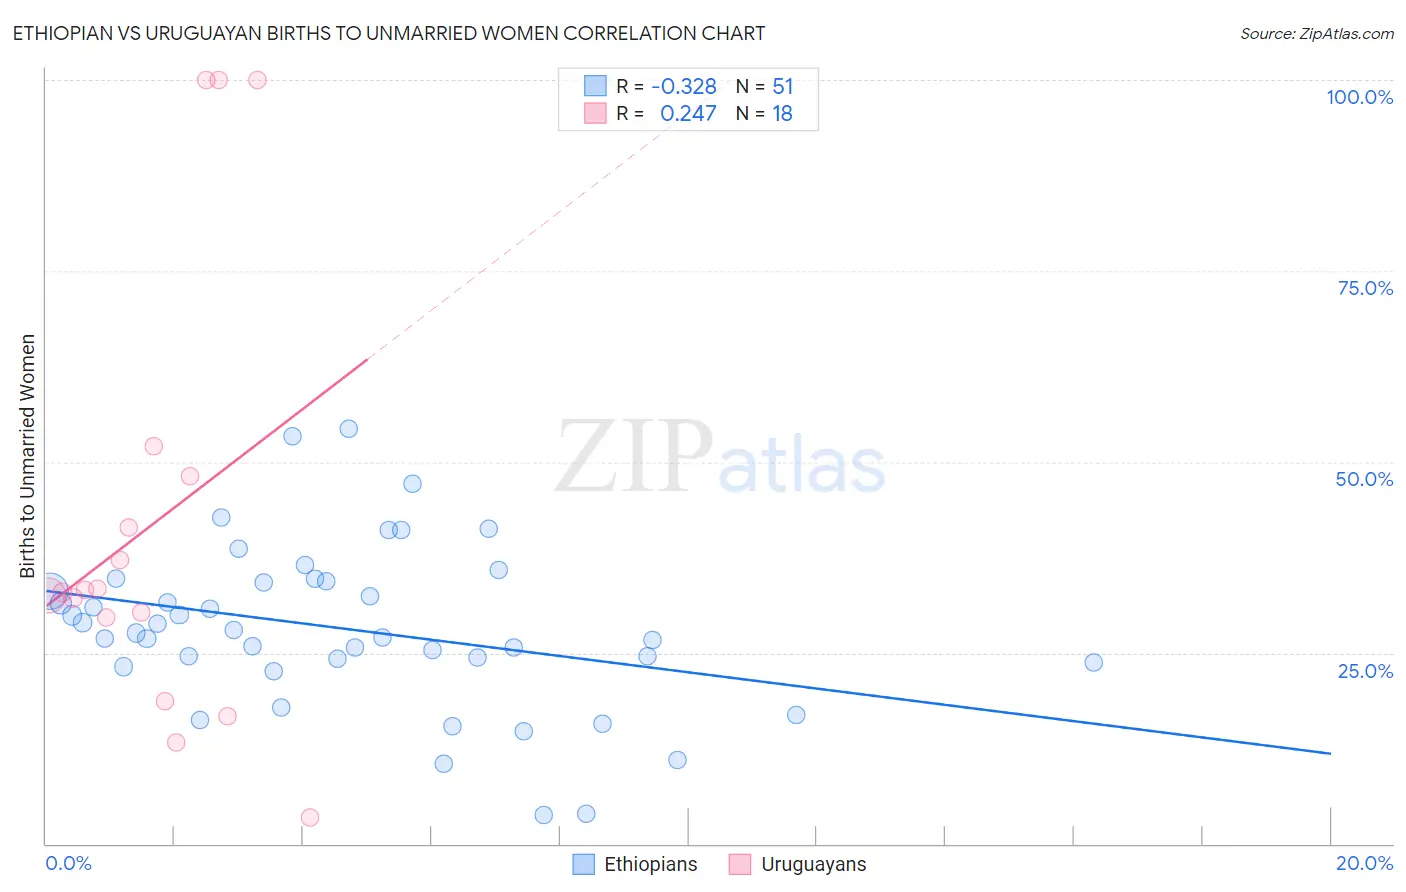
Ethiopian vs Uruguayan Births to Unmarried Women Correlation Chart
The statistical analysis conducted on geographies consisting of 215,740,529 people shows a mild negative correlation between the proportion of Ethiopians and percentage of births to unmarried women in the United States with a correlation coefficient (R) of -0.328 and weighted average of 29.8%. Similarly, the statistical analysis conducted on geographies consisting of 140,023,012 people shows a weak positive correlation between the proportion of Uruguayans and percentage of births to unmarried women in the United States with a correlation coefficient (R) of 0.247 and weighted average of 33.1%, a difference of 10.9%.
Births to Unmarried Women Correlation Summary
| Measurement | Ethiopian | Uruguayan |
| Minimum | 3.7% | 3.4% |
| Maximum | 54.3% | 100.0% |
| Range | 50.6% | 96.6% |
| Mean | 28.2% | 41.9% |
| Median | 27.6% | 33.1% |
| Interquartile 25% (IQ1) | 23.8% | 29.6% |
| Interquartile 75% (IQ3) | 34.4% | 48.1% |
| Interquartile Range (IQR) | 10.6% | 18.5% |
| Standard Deviation (Sample) | 10.7% | 29.2% |
| Standard Deviation (Population) | 10.6% | 28.3% |
Similar Demographics by Births to Unmarried Women
Demographics Similar to Ethiopians by Births to Unmarried Women
In terms of births to unmarried women, the demographic groups most similar to Ethiopians are Immigrants from Italy (29.9%, a difference of 0.080%), Immigrants from Croatia (29.8%, a difference of 0.22%), Scandinavian (29.8%, a difference of 0.28%), Immigrants from Netherlands (29.9%, a difference of 0.29%), and Immigrants from Norway (29.9%, a difference of 0.31%).
| Demographics | Rating | Rank | Births to Unmarried Women |
| Paraguayans | 93.5 /100 | #108 | Exceptional 29.7% |
| Greeks | 93.4 /100 | #109 | Exceptional 29.7% |
| Immigrants | Ethiopia | 93.4 /100 | #110 | Exceptional 29.7% |
| Immigrants | Hungary | 93.0 /100 | #111 | Exceptional 29.7% |
| Basques | 93.0 /100 | #112 | Exceptional 29.7% |
| Scandinavians | 92.7 /100 | #113 | Exceptional 29.8% |
| Immigrants | Croatia | 92.6 /100 | #114 | Exceptional 29.8% |
| Ethiopians | 91.9 /100 | #115 | Exceptional 29.8% |
| Immigrants | Italy | 91.7 /100 | #116 | Exceptional 29.9% |
| Immigrants | Netherlands | 91.1 /100 | #117 | Exceptional 29.9% |
| Immigrants | Norway | 91.0 /100 | #118 | Exceptional 29.9% |
| Argentineans | 90.5 /100 | #119 | Exceptional 30.0% |
| Ugandans | 89.2 /100 | #120 | Excellent 30.1% |
| Koreans | 88.9 /100 | #121 | Excellent 30.1% |
| Immigrants | Argentina | 88.7 /100 | #122 | Excellent 30.1% |
Demographics Similar to Uruguayans by Births to Unmarried Women
In terms of births to unmarried women, the demographic groups most similar to Uruguayans are German Russian (33.1%, a difference of 0.060%), Immigrants from Africa (33.0%, a difference of 0.29%), Immigrants from Sudan (33.2%, a difference of 0.29%), Ute (33.0%, a difference of 0.31%), and Hawaiian (33.2%, a difference of 0.32%).
| Demographics | Rating | Rank | Births to Unmarried Women |
| Immigrants | Thailand | 18.9 /100 | #199 | Poor 32.8% |
| Immigrants | Germany | 18.8 /100 | #200 | Poor 32.8% |
| Immigrants | Burma/Myanmar | 16.7 /100 | #201 | Poor 32.9% |
| Immigrants | Micronesia | 16.6 /100 | #202 | Poor 32.9% |
| Ute | 14.4 /100 | #203 | Poor 33.0% |
| Immigrants | Africa | 14.3 /100 | #204 | Poor 33.0% |
| German Russians | 13.1 /100 | #205 | Poor 33.1% |
| Uruguayans | 12.8 /100 | #206 | Poor 33.1% |
| Immigrants | Sudan | 11.5 /100 | #207 | Poor 33.2% |
| Hawaiians | 11.3 /100 | #208 | Poor 33.2% |
| Whites/Caucasians | 10.7 /100 | #209 | Poor 33.3% |
| Scotch-Irish | 10.7 /100 | #210 | Poor 33.3% |
| Ecuadorians | 10.5 /100 | #211 | Poor 33.3% |
| Celtics | 10.2 /100 | #212 | Poor 33.3% |
| Immigrants | Costa Rica | 9.5 /100 | #213 | Tragic 33.4% |