Ethiopian vs Immigrants from Lebanon Single Female Poverty
COMPARE
Ethiopian
Immigrants from Lebanon
Single Female Poverty
Single Female Poverty Comparison
Ethiopians
Immigrants from Lebanon
19.9%
SINGLE FEMALE POVERTY
96.7/ 100
METRIC RATING
106th/ 347
METRIC RANK
19.6%
SINGLE FEMALE POVERTY
98.8/ 100
METRIC RATING
90th/ 347
METRIC RANK
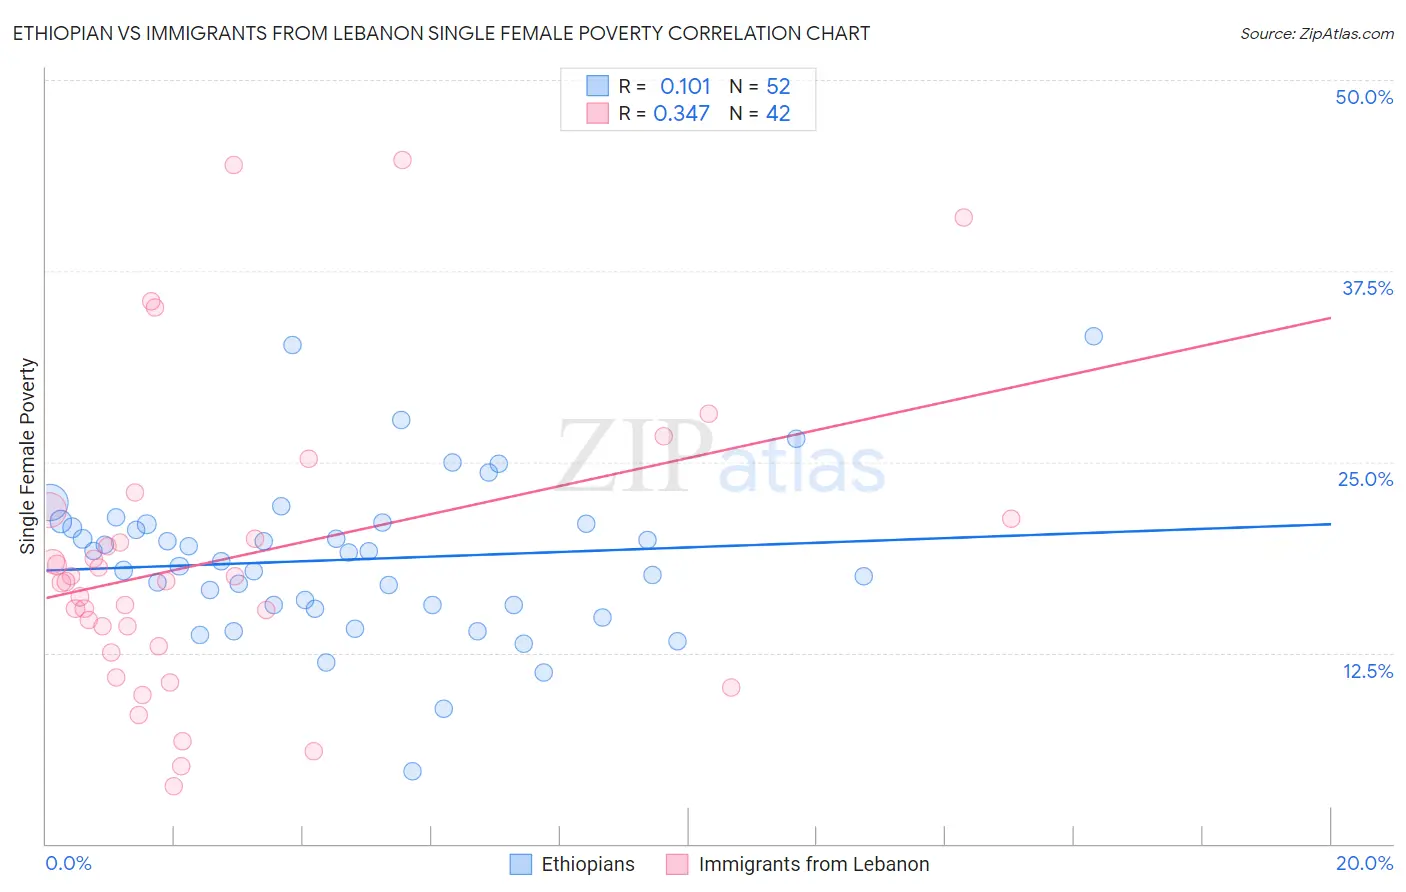
Ethiopian vs Immigrants from Lebanon Single Female Poverty Correlation Chart
The statistical analysis conducted on geographies consisting of 221,686,273 people shows a poor positive correlation between the proportion of Ethiopians and poverty level among single females in the United States with a correlation coefficient (R) of 0.101 and weighted average of 19.9%. Similarly, the statistical analysis conducted on geographies consisting of 214,985,919 people shows a mild positive correlation between the proportion of Immigrants from Lebanon and poverty level among single females in the United States with a correlation coefficient (R) of 0.347 and weighted average of 19.6%, a difference of 1.8%.
Single Female Poverty Correlation Summary
| Measurement | Ethiopian | Immigrants from Lebanon |
| Minimum | 4.8% | 3.8% |
| Maximum | 33.2% | 44.8% |
| Range | 28.4% | 41.0% |
| Mean | 18.6% | 18.7% |
| Median | 18.8% | 17.2% |
| Interquartile 25% (IQ1) | 15.6% | 13.0% |
| Interquartile 75% (IQ3) | 20.9% | 21.3% |
| Interquartile Range (IQR) | 5.3% | 8.3% |
| Standard Deviation (Sample) | 5.2% | 9.8% |
| Standard Deviation (Population) | 5.1% | 9.6% |
Demographics Similar to Ethiopians and Immigrants from Lebanon by Single Female Poverty
In terms of single female poverty, the demographic groups most similar to Ethiopians are Immigrants from Syria (19.9%, a difference of 0.020%), Native Hawaiian (19.9%, a difference of 0.070%), Israeli (19.9%, a difference of 0.090%), Chilean (19.9%, a difference of 0.10%), and Immigrants from Southern Europe (19.9%, a difference of 0.22%). Similarly, the demographic groups most similar to Immigrants from Lebanon are Soviet Union (19.6%, a difference of 0.060%), Italian (19.6%, a difference of 0.11%), Immigrants from Austria (19.6%, a difference of 0.12%), Immigrants from Ukraine (19.5%, a difference of 0.17%), and Afghan (19.5%, a difference of 0.19%).
| Demographics | Rating | Rank | Single Female Poverty |
| Afghans | 99.0 /100 | #88 | Exceptional 19.5% |
| Immigrants | Ukraine | 99.0 /100 | #89 | Exceptional 19.5% |
| Immigrants | Lebanon | 98.8 /100 | #90 | Exceptional 19.6% |
| Soviet Union | 98.8 /100 | #91 | Exceptional 19.6% |
| Italians | 98.8 /100 | #92 | Exceptional 19.6% |
| Immigrants | Austria | 98.8 /100 | #93 | Exceptional 19.6% |
| Romanians | 98.6 /100 | #94 | Exceptional 19.6% |
| Estonians | 98.2 /100 | #95 | Exceptional 19.7% |
| Immigrants | Brazil | 98.2 /100 | #96 | Exceptional 19.7% |
| Croatians | 98.1 /100 | #97 | Exceptional 19.7% |
| Immigrants | France | 97.9 /100 | #98 | Exceptional 19.7% |
| Sierra Leoneans | 97.9 /100 | #99 | Exceptional 19.7% |
| Ukrainians | 97.6 /100 | #100 | Exceptional 19.8% |
| Immigrants | Belgium | 97.3 /100 | #101 | Exceptional 19.8% |
| Immigrants | Cameroon | 97.3 /100 | #102 | Exceptional 19.8% |
| Immigrants | Southern Europe | 97.1 /100 | #103 | Exceptional 19.9% |
| Chileans | 96.9 /100 | #104 | Exceptional 19.9% |
| Israelis | 96.9 /100 | #105 | Exceptional 19.9% |
| Ethiopians | 96.7 /100 | #106 | Exceptional 19.9% |
| Immigrants | Syria | 96.7 /100 | #107 | Exceptional 19.9% |
| Native Hawaiians | 96.6 /100 | #108 | Exceptional 19.9% |