Ethiopian vs Spanish American Male Unemployment
COMPARE
Ethiopian
Spanish American
Male Unemployment
Male Unemployment Comparison
Ethiopians
Spanish Americans
5.1%
MALE UNEMPLOYMENT
91.3/ 100
METRIC RATING
107th/ 347
METRIC RANK
5.7%
MALE UNEMPLOYMENT
0.3/ 100
METRIC RATING
251st/ 347
METRIC RANK
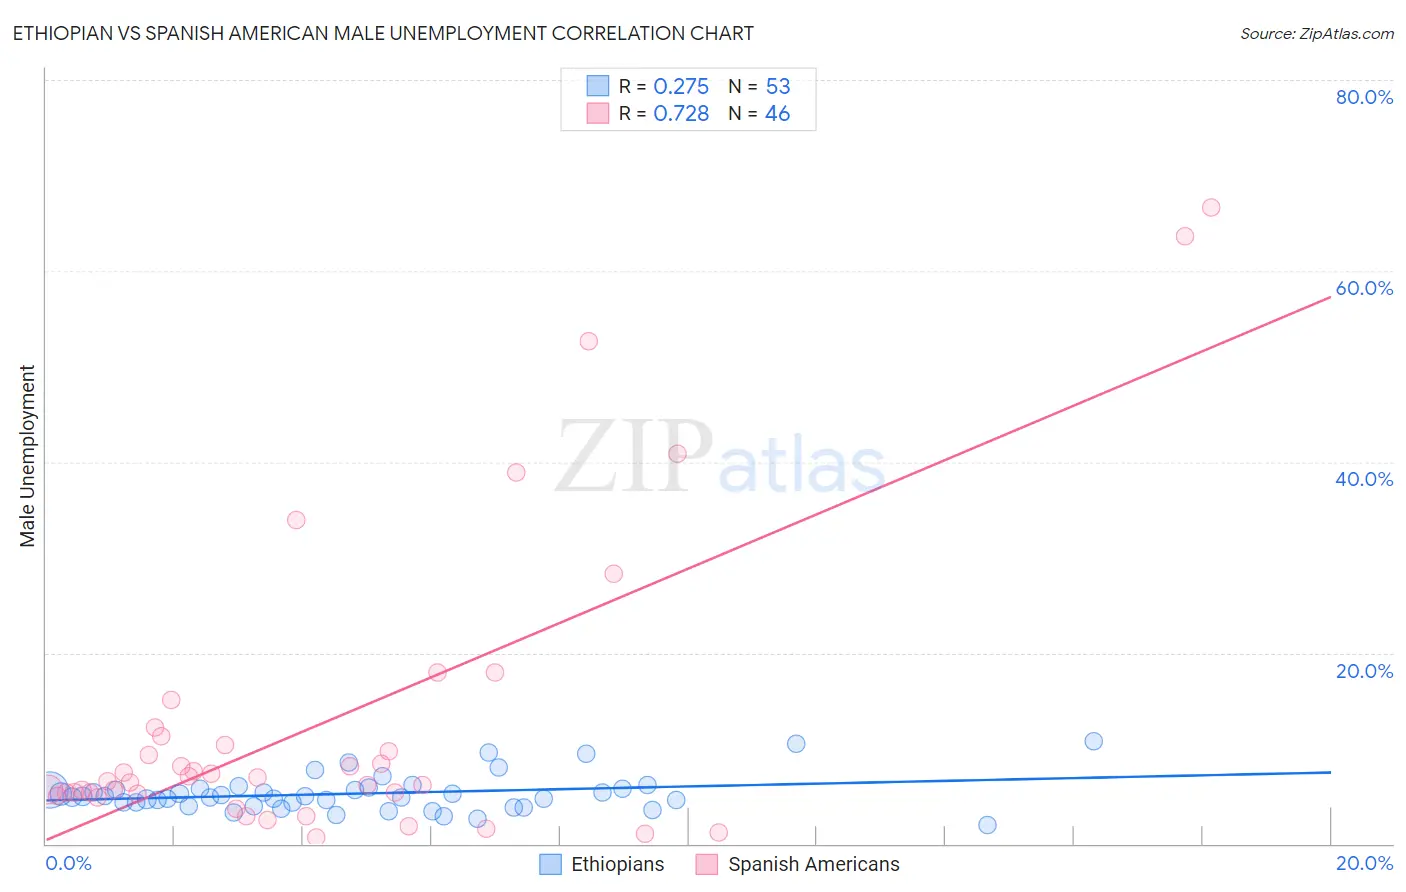
Ethiopian vs Spanish American Male Unemployment Correlation Chart
The statistical analysis conducted on geographies consisting of 222,844,986 people shows a weak positive correlation between the proportion of Ethiopians and unemployment rate among males in the United States with a correlation coefficient (R) of 0.275 and weighted average of 5.1%. Similarly, the statistical analysis conducted on geographies consisting of 103,047,873 people shows a strong positive correlation between the proportion of Spanish Americans and unemployment rate among males in the United States with a correlation coefficient (R) of 0.728 and weighted average of 5.7%, a difference of 12.1%.
Male Unemployment Correlation Summary
| Measurement | Ethiopian | Spanish American |
| Minimum | 1.9% | 0.60% |
| Maximum | 10.8% | 66.7% |
| Range | 8.9% | 66.1% |
| Mean | 5.3% | 12.8% |
| Median | 4.9% | 6.7% |
| Interquartile 25% (IQ1) | 4.1% | 5.2% |
| Interquartile 75% (IQ3) | 5.8% | 11.3% |
| Interquartile Range (IQR) | 1.7% | 6.1% |
| Standard Deviation (Sample) | 1.9% | 15.8% |
| Standard Deviation (Population) | 1.9% | 15.7% |
Similar Demographics by Male Unemployment
Demographics Similar to Ethiopians by Male Unemployment
In terms of male unemployment, the demographic groups most similar to Ethiopians are Immigrants from Nicaragua (5.1%, a difference of 0.010%), Immigrants from Ethiopia (5.1%, a difference of 0.040%), Immigrants from Pakistan (5.1%, a difference of 0.070%), Immigrants from Czechoslovakia (5.1%, a difference of 0.080%), and Immigrants from Chile (5.1%, a difference of 0.090%).
| Demographics | Rating | Rank | Male Unemployment |
| Russians | 92.9 /100 | #100 | Exceptional 5.1% |
| German Russians | 92.7 /100 | #101 | Exceptional 5.1% |
| Immigrants | France | 92.7 /100 | #102 | Exceptional 5.1% |
| Immigrants | Jordan | 91.9 /100 | #103 | Exceptional 5.1% |
| Immigrants | Chile | 91.8 /100 | #104 | Exceptional 5.1% |
| Immigrants | Czechoslovakia | 91.7 /100 | #105 | Exceptional 5.1% |
| Immigrants | Ethiopia | 91.5 /100 | #106 | Exceptional 5.1% |
| Ethiopians | 91.3 /100 | #107 | Exceptional 5.1% |
| Immigrants | Nicaragua | 91.2 /100 | #108 | Exceptional 5.1% |
| Immigrants | Pakistan | 90.9 /100 | #109 | Exceptional 5.1% |
| Immigrants | England | 90.8 /100 | #110 | Exceptional 5.1% |
| Immigrants | Eastern Asia | 90.8 /100 | #111 | Exceptional 5.1% |
| Immigrants | Moldova | 90.3 /100 | #112 | Exceptional 5.1% |
| Immigrants | Austria | 90.3 /100 | #113 | Exceptional 5.1% |
| Romanians | 89.8 /100 | #114 | Excellent 5.1% |
Demographics Similar to Spanish Americans by Male Unemployment
In terms of male unemployment, the demographic groups most similar to Spanish Americans are Immigrants from Bahamas (5.7%, a difference of 0.040%), Cree (5.7%, a difference of 0.29%), Marshallese (5.7%, a difference of 0.36%), Mexican (5.8%, a difference of 0.57%), and Hawaiian (5.7%, a difference of 0.68%).
| Demographics | Rating | Rank | Male Unemployment |
| Immigrants | El Salvador | 0.7 /100 | #244 | Tragic 5.7% |
| Yaqui | 0.7 /100 | #245 | Tragic 5.7% |
| Iroquois | 0.6 /100 | #246 | Tragic 5.7% |
| Hawaiians | 0.6 /100 | #247 | Tragic 5.7% |
| Marshallese | 0.5 /100 | #248 | Tragic 5.7% |
| Cree | 0.4 /100 | #249 | Tragic 5.7% |
| Immigrants | Bahamas | 0.4 /100 | #250 | Tragic 5.7% |
| Spanish Americans | 0.3 /100 | #251 | Tragic 5.7% |
| Mexicans | 0.2 /100 | #252 | Tragic 5.8% |
| Mexican American Indians | 0.2 /100 | #253 | Tragic 5.8% |
| Japanese | 0.2 /100 | #254 | Tragic 5.8% |
| Kiowa | 0.2 /100 | #255 | Tragic 5.8% |
| Comanche | 0.2 /100 | #256 | Tragic 5.8% |
| Hispanics or Latinos | 0.1 /100 | #257 | Tragic 5.8% |
| Dutch West Indians | 0.1 /100 | #258 | Tragic 5.8% |