English vs Malaysian Householder Income Under 25 years
COMPARE
English
Malaysian
Householder Income Under 25 years
Householder Income Under 25 years Comparison
English
Malaysians
$50,805
HOUSEHOLDER INCOME UNDER 25 YEARS
3.3/ 100
METRIC RATING
236th/ 347
METRIC RANK
$51,615
HOUSEHOLDER INCOME UNDER 25 YEARS
19.7/ 100
METRIC RATING
190th/ 347
METRIC RANK
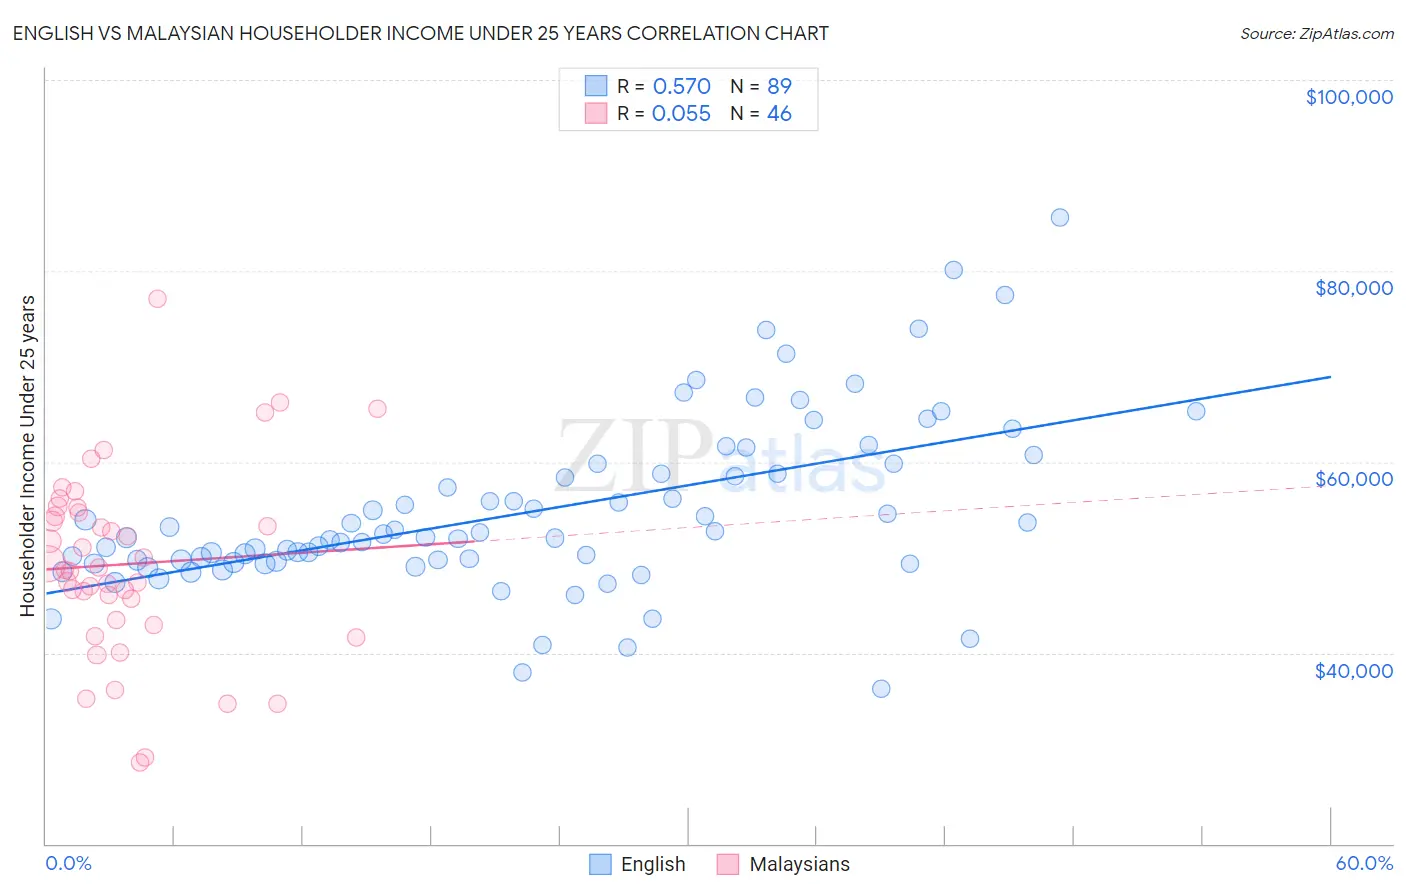
English vs Malaysian Householder Income Under 25 years Correlation Chart
The statistical analysis conducted on geographies consisting of 440,590,191 people shows a substantial positive correlation between the proportion of English and household income with householder under the age of 25 in the United States with a correlation coefficient (R) of 0.570 and weighted average of $50,805. Similarly, the statistical analysis conducted on geographies consisting of 207,003,790 people shows a slight positive correlation between the proportion of Malaysians and household income with householder under the age of 25 in the United States with a correlation coefficient (R) of 0.055 and weighted average of $51,615, a difference of 1.6%.
Householder Income Under 25 years Correlation Summary
| Measurement | English | Malaysian |
| Minimum | $36,250 | $28,500 |
| Maximum | $85,625 | $77,081 |
| Range | $49,375 | $48,581 |
| Mean | $54,811 | $49,286 |
| Median | $52,083 | $48,791 |
| Interquartile 25% (IQ1) | $49,480 | $43,424 |
| Interquartile 75% (IQ3) | $59,272 | $54,664 |
| Interquartile Range (IQR) | $9,791 | $11,240 |
| Standard Deviation (Sample) | $9,060 | $9,769 |
| Standard Deviation (Population) | $9,009 | $9,663 |
Similar Demographics by Householder Income Under 25 years
Demographics Similar to English by Householder Income Under 25 years
In terms of householder income under 25 years, the demographic groups most similar to English are German ($50,804, a difference of 0.0%), Iraqi ($50,802, a difference of 0.010%), Kenyan ($50,815, a difference of 0.020%), Spanish ($50,813, a difference of 0.020%), and Pennsylvania German ($50,852, a difference of 0.090%).
| Demographics | Rating | Rank | Householder Income Under 25 years |
| Yuman | 4.4 /100 | #229 | Tragic $50,933 |
| Jamaicans | 4.4 /100 | #230 | Tragic $50,929 |
| Ugandans | 4.3 /100 | #231 | Tragic $50,923 |
| Slovenes | 4.0 /100 | #232 | Tragic $50,886 |
| Pennsylvania Germans | 3.7 /100 | #233 | Tragic $50,852 |
| Kenyans | 3.3 /100 | #234 | Tragic $50,815 |
| Spanish | 3.3 /100 | #235 | Tragic $50,813 |
| English | 3.3 /100 | #236 | Tragic $50,805 |
| Germans | 3.3 /100 | #237 | Tragic $50,804 |
| Iraqis | 3.2 /100 | #238 | Tragic $50,802 |
| Immigrants | Caribbean | 2.9 /100 | #239 | Tragic $50,757 |
| Immigrants | Lebanon | 2.7 /100 | #240 | Tragic $50,729 |
| Immigrants | Micronesia | 2.5 /100 | #241 | Tragic $50,691 |
| Cubans | 2.3 /100 | #242 | Tragic $50,655 |
| Immigrants | Thailand | 2.2 /100 | #243 | Tragic $50,645 |
Demographics Similar to Malaysians by Householder Income Under 25 years
In terms of householder income under 25 years, the demographic groups most similar to Malaysians are Panamanian ($51,611, a difference of 0.010%), West Indian ($51,583, a difference of 0.060%), Immigrants from Eritrea ($51,574, a difference of 0.080%), Croatian ($51,662, a difference of 0.090%), and Northern European ($51,678, a difference of 0.12%).
| Demographics | Rating | Rank | Householder Income Under 25 years |
| Mexican American Indians | 27.0 /100 | #183 | Fair $51,783 |
| Paiute | 25.1 /100 | #184 | Fair $51,743 |
| Immigrants | Latvia | 24.8 /100 | #185 | Fair $51,737 |
| Alaskan Athabascans | 23.8 /100 | #186 | Fair $51,713 |
| Immigrants | South Africa | 23.4 /100 | #187 | Fair $51,705 |
| Northern Europeans | 22.2 /100 | #188 | Fair $51,678 |
| Croatians | 21.6 /100 | #189 | Fair $51,662 |
| Malaysians | 19.7 /100 | #190 | Poor $51,615 |
| Panamanians | 19.5 /100 | #191 | Poor $51,611 |
| West Indians | 18.5 /100 | #192 | Poor $51,583 |
| Immigrants | Eritrea | 18.1 /100 | #193 | Poor $51,574 |
| Guatemalans | 16.4 /100 | #194 | Poor $51,525 |
| Estonians | 16.4 /100 | #195 | Poor $51,523 |
| Palestinians | 16.1 /100 | #196 | Poor $51,515 |
| Pima | 15.7 /100 | #197 | Poor $51,503 |