Ecuadorian vs Hopi In Labor Force | Age 25-29
COMPARE
Ecuadorian
Hopi
In Labor Force | Age 25-29
In Labor Force | Age 25-29 Comparison
Ecuadorians
Hopi
84.4%
IN LABOR FORCE | AGE 25-29
14.8/ 100
METRIC RATING
205th/ 347
METRIC RANK
76.5%
IN LABOR FORCE | AGE 25-29
0.0/ 100
METRIC RATING
344th/ 347
METRIC RANK
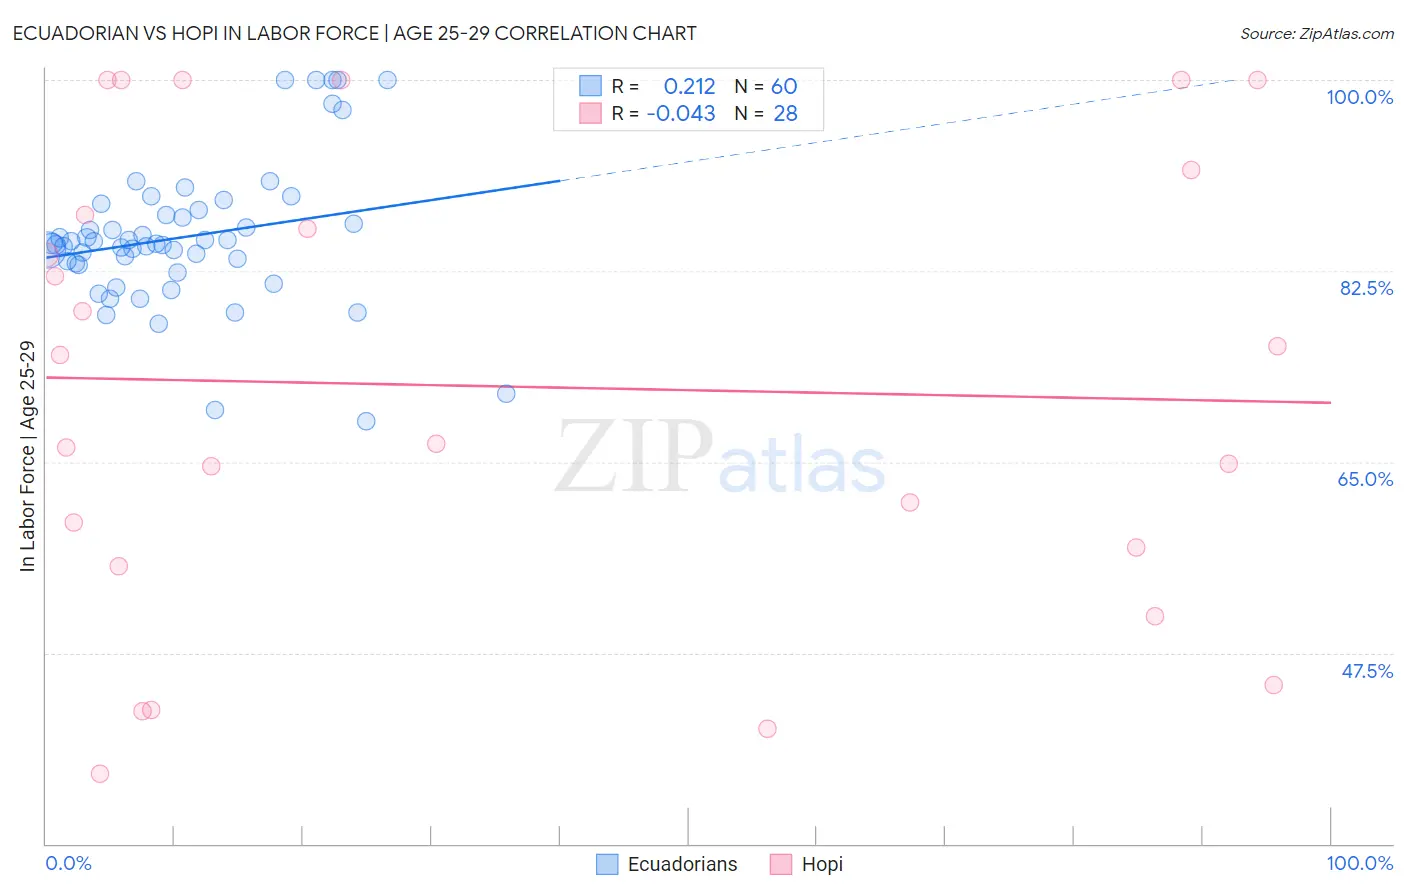
Ecuadorian vs Hopi In Labor Force | Age 25-29 Correlation Chart
The statistical analysis conducted on geographies consisting of 317,761,699 people shows a weak positive correlation between the proportion of Ecuadorians and labor force participation rate among population between the ages 25 and 29 in the United States with a correlation coefficient (R) of 0.212 and weighted average of 84.4%. Similarly, the statistical analysis conducted on geographies consisting of 74,722,734 people shows no correlation between the proportion of Hopi and labor force participation rate among population between the ages 25 and 29 in the United States with a correlation coefficient (R) of -0.043 and weighted average of 76.5%, a difference of 10.3%.
In Labor Force | Age 25-29 Correlation Summary
| Measurement | Ecuadorian | Hopi |
| Minimum | 68.7% | 36.4% |
| Maximum | 100.0% | 100.0% |
| Range | 31.3% | 63.6% |
| Mean | 85.6% | 71.9% |
| Median | 85.0% | 70.8% |
| Interquartile 25% (IQ1) | 83.1% | 56.3% |
| Interquartile 75% (IQ3) | 87.8% | 89.7% |
| Interquartile Range (IQR) | 4.7% | 33.4% |
| Standard Deviation (Sample) | 6.7% | 21.1% |
| Standard Deviation (Population) | 6.6% | 20.7% |
Similar Demographics by In Labor Force | Age 25-29
Demographics Similar to Ecuadorians by In Labor Force | Age 25-29
In terms of in labor force | age 25-29, the demographic groups most similar to Ecuadorians are Venezuelan (84.4%, a difference of 0.0%), Immigrants from Afghanistan (84.4%, a difference of 0.010%), Immigrants from Cambodia (84.4%, a difference of 0.010%), Laotian (84.4%, a difference of 0.020%), and Afghan (84.4%, a difference of 0.020%).
| Demographics | Rating | Rank | In Labor Force | Age 25-29 |
| Immigrants | Iraq | 19.0 /100 | #198 | Poor 84.4% |
| Immigrants | Germany | 18.3 /100 | #199 | Poor 84.4% |
| Immigrants | Kazakhstan | 17.5 /100 | #200 | Poor 84.4% |
| Laotians | 16.6 /100 | #201 | Poor 84.4% |
| Afghans | 15.9 /100 | #202 | Poor 84.4% |
| Immigrants | Afghanistan | 15.6 /100 | #203 | Poor 84.4% |
| Venezuelans | 15.1 /100 | #204 | Poor 84.4% |
| Ecuadorians | 14.8 /100 | #205 | Poor 84.4% |
| Immigrants | Cambodia | 14.3 /100 | #206 | Poor 84.4% |
| Immigrants | Armenia | 13.3 /100 | #207 | Poor 84.4% |
| Immigrants | Indonesia | 13.2 /100 | #208 | Poor 84.4% |
| Immigrants | Jordan | 12.8 /100 | #209 | Poor 84.4% |
| Chinese | 12.7 /100 | #210 | Poor 84.3% |
| Immigrants | Venezuela | 12.6 /100 | #211 | Poor 84.3% |
| Sub-Saharan Africans | 11.7 /100 | #212 | Poor 84.3% |
Demographics Similar to Hopi by In Labor Force | Age 25-29
In terms of in labor force | age 25-29, the demographic groups most similar to Hopi are Arapaho (76.6%, a difference of 0.060%), Pueblo (77.5%, a difference of 1.3%), Tohono O'odham (77.5%, a difference of 1.3%), Paiute (78.1%, a difference of 2.1%), and Immigrants from Yemen (78.2%, a difference of 2.2%).
| Demographics | Rating | Rank | In Labor Force | Age 25-29 |
| Sioux | 0.0 /100 | #333 | Tragic 79.7% |
| Yuman | 0.0 /100 | #334 | Tragic 79.3% |
| Natives/Alaskans | 0.0 /100 | #335 | Tragic 79.3% |
| Apache | 0.0 /100 | #336 | Tragic 79.2% |
| Crow | 0.0 /100 | #337 | Tragic 78.6% |
| Lumbee | 0.0 /100 | #338 | Tragic 78.3% |
| Immigrants | Yemen | 0.0 /100 | #339 | Tragic 78.2% |
| Paiute | 0.0 /100 | #340 | Tragic 78.1% |
| Tohono O'odham | 0.0 /100 | #341 | Tragic 77.5% |
| Pueblo | 0.0 /100 | #342 | Tragic 77.5% |
| Arapaho | 0.0 /100 | #343 | Tragic 76.6% |
| Hopi | 0.0 /100 | #344 | Tragic 76.5% |
| Navajo | 0.0 /100 | #345 | Tragic 74.6% |
| Pima | 0.0 /100 | #346 | Tragic 74.3% |
| Yup'ik | 0.0 /100 | #347 | Tragic 73.1% |