Ecuadorian vs Chilean Single Female Poverty
COMPARE
Ecuadorian
Chilean
Single Female Poverty
Single Female Poverty Comparison
Ecuadorians
Chileans
21.6%
SINGLE FEMALE POVERTY
12.3/ 100
METRIC RATING
215th/ 347
METRIC RANK
19.9%
SINGLE FEMALE POVERTY
96.9/ 100
METRIC RATING
104th/ 347
METRIC RANK
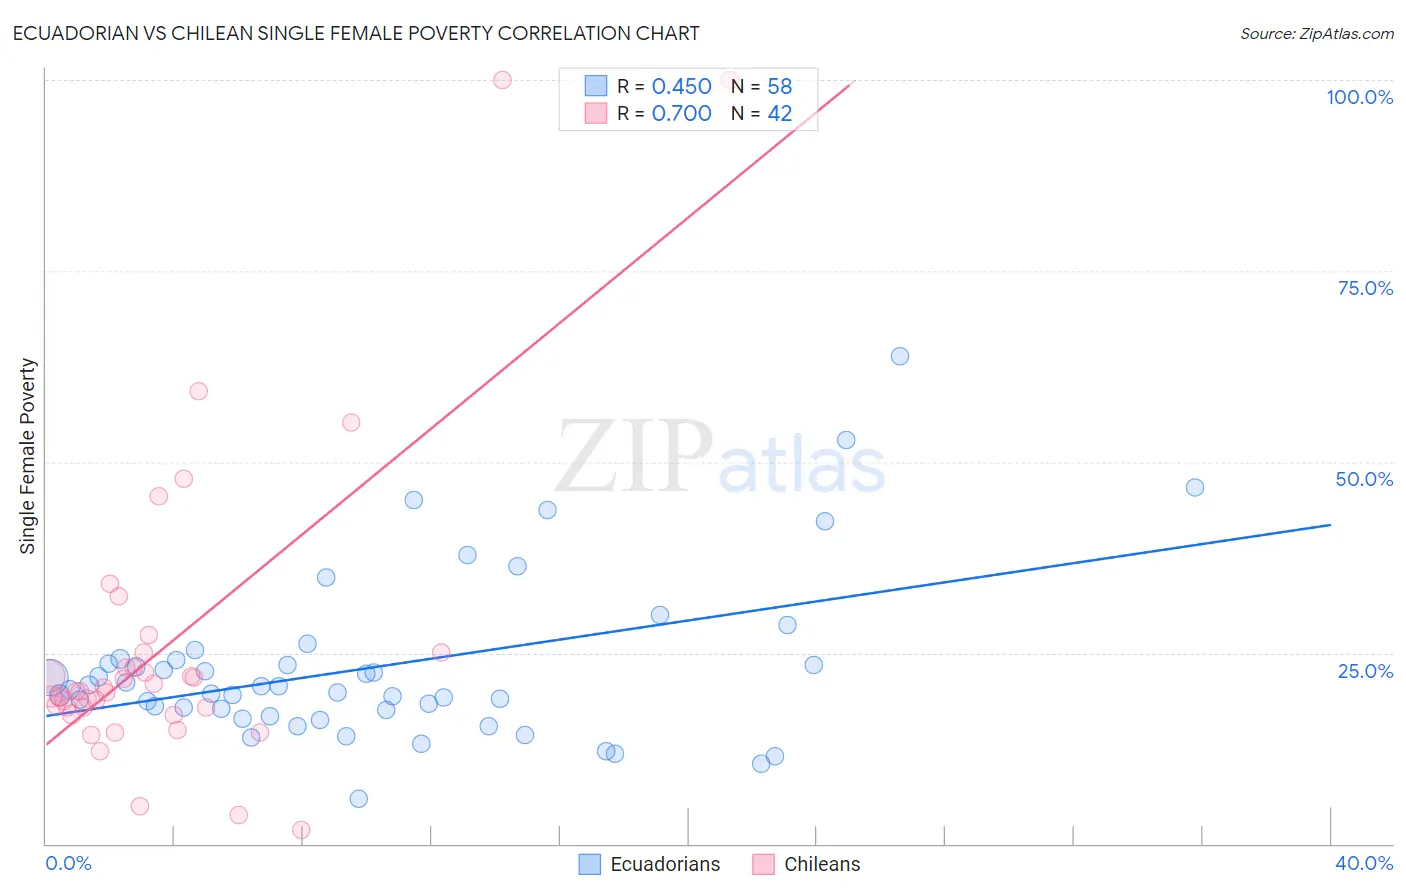
Ecuadorian vs Chilean Single Female Poverty Correlation Chart
The statistical analysis conducted on geographies consisting of 313,951,403 people shows a moderate positive correlation between the proportion of Ecuadorians and poverty level among single females in the United States with a correlation coefficient (R) of 0.450 and weighted average of 21.6%. Similarly, the statistical analysis conducted on geographies consisting of 254,415,237 people shows a strong positive correlation between the proportion of Chileans and poverty level among single females in the United States with a correlation coefficient (R) of 0.700 and weighted average of 19.9%, a difference of 8.9%.
Single Female Poverty Correlation Summary
| Measurement | Ecuadorian | Chilean |
| Minimum | 5.9% | 1.8% |
| Maximum | 63.8% | 100.0% |
| Range | 57.9% | 98.2% |
| Mean | 23.1% | 25.9% |
| Median | 20.4% | 19.9% |
| Interquartile 25% (IQ1) | 17.5% | 17.8% |
| Interquartile 75% (IQ3) | 24.0% | 25.0% |
| Interquartile Range (IQR) | 6.5% | 7.2% |
| Standard Deviation (Sample) | 10.9% | 20.4% |
| Standard Deviation (Population) | 10.8% | 20.1% |
Similar Demographics by Single Female Poverty
Demographics Similar to Ecuadorians by Single Female Poverty
In terms of single female poverty, the demographic groups most similar to Ecuadorians are Immigrants from Barbados (21.7%, a difference of 0.020%), Immigrants from St. Vincent and the Grenadines (21.7%, a difference of 0.090%), Immigrants from Nicaragua (21.6%, a difference of 0.13%), Guamanian/Chamorro (21.6%, a difference of 0.19%), and Jamaican (21.6%, a difference of 0.22%).
| Demographics | Rating | Rank | Single Female Poverty |
| Haitians | 15.4 /100 | #208 | Poor 21.6% |
| Immigrants | Eastern Africa | 15.1 /100 | #209 | Poor 21.6% |
| Immigrants | Panama | 14.4 /100 | #210 | Poor 21.6% |
| Icelanders | 14.0 /100 | #211 | Poor 21.6% |
| Jamaicans | 14.0 /100 | #212 | Poor 21.6% |
| Guamanians/Chamorros | 13.7 /100 | #213 | Poor 21.6% |
| Immigrants | Nicaragua | 13.3 /100 | #214 | Poor 21.6% |
| Ecuadorians | 12.3 /100 | #215 | Poor 21.6% |
| Immigrants | Barbados | 12.2 /100 | #216 | Poor 21.7% |
| Immigrants | St. Vincent and the Grenadines | 11.7 /100 | #217 | Poor 21.7% |
| Nepalese | 9.7 /100 | #218 | Tragic 21.7% |
| Panamanians | 9.4 /100 | #219 | Tragic 21.7% |
| Germans | 8.3 /100 | #220 | Tragic 21.8% |
| Immigrants | Grenada | 8.0 /100 | #221 | Tragic 21.8% |
| Immigrants | Eritrea | 7.9 /100 | #222 | Tragic 21.8% |
Demographics Similar to Chileans by Single Female Poverty
In terms of single female poverty, the demographic groups most similar to Chileans are Israeli (19.9%, a difference of 0.010%), Ethiopian (19.9%, a difference of 0.10%), Immigrants from Southern Europe (19.9%, a difference of 0.12%), Immigrants from Syria (19.9%, a difference of 0.12%), and Native Hawaiian (19.9%, a difference of 0.17%).
| Demographics | Rating | Rank | Single Female Poverty |
| Croatians | 98.1 /100 | #97 | Exceptional 19.7% |
| Immigrants | France | 97.9 /100 | #98 | Exceptional 19.7% |
| Sierra Leoneans | 97.9 /100 | #99 | Exceptional 19.7% |
| Ukrainians | 97.6 /100 | #100 | Exceptional 19.8% |
| Immigrants | Belgium | 97.3 /100 | #101 | Exceptional 19.8% |
| Immigrants | Cameroon | 97.3 /100 | #102 | Exceptional 19.8% |
| Immigrants | Southern Europe | 97.1 /100 | #103 | Exceptional 19.9% |
| Chileans | 96.9 /100 | #104 | Exceptional 19.9% |
| Israelis | 96.9 /100 | #105 | Exceptional 19.9% |
| Ethiopians | 96.7 /100 | #106 | Exceptional 19.9% |
| Immigrants | Syria | 96.7 /100 | #107 | Exceptional 19.9% |
| Native Hawaiians | 96.6 /100 | #108 | Exceptional 19.9% |
| Colombians | 96.6 /100 | #109 | Exceptional 19.9% |
| Immigrants | Western Asia | 96.5 /100 | #110 | Exceptional 19.9% |
| Carpatho Rusyns | 96.1 /100 | #111 | Exceptional 20.0% |