Ecuadorian vs Japanese Single Female Poverty
COMPARE
Ecuadorian
Japanese
Single Female Poverty
Single Female Poverty Comparison
Ecuadorians
Japanese
21.6%
SINGLE FEMALE POVERTY
12.3/ 100
METRIC RATING
215th/ 347
METRIC RANK
21.3%
SINGLE FEMALE POVERTY
26.4/ 100
METRIC RATING
197th/ 347
METRIC RANK
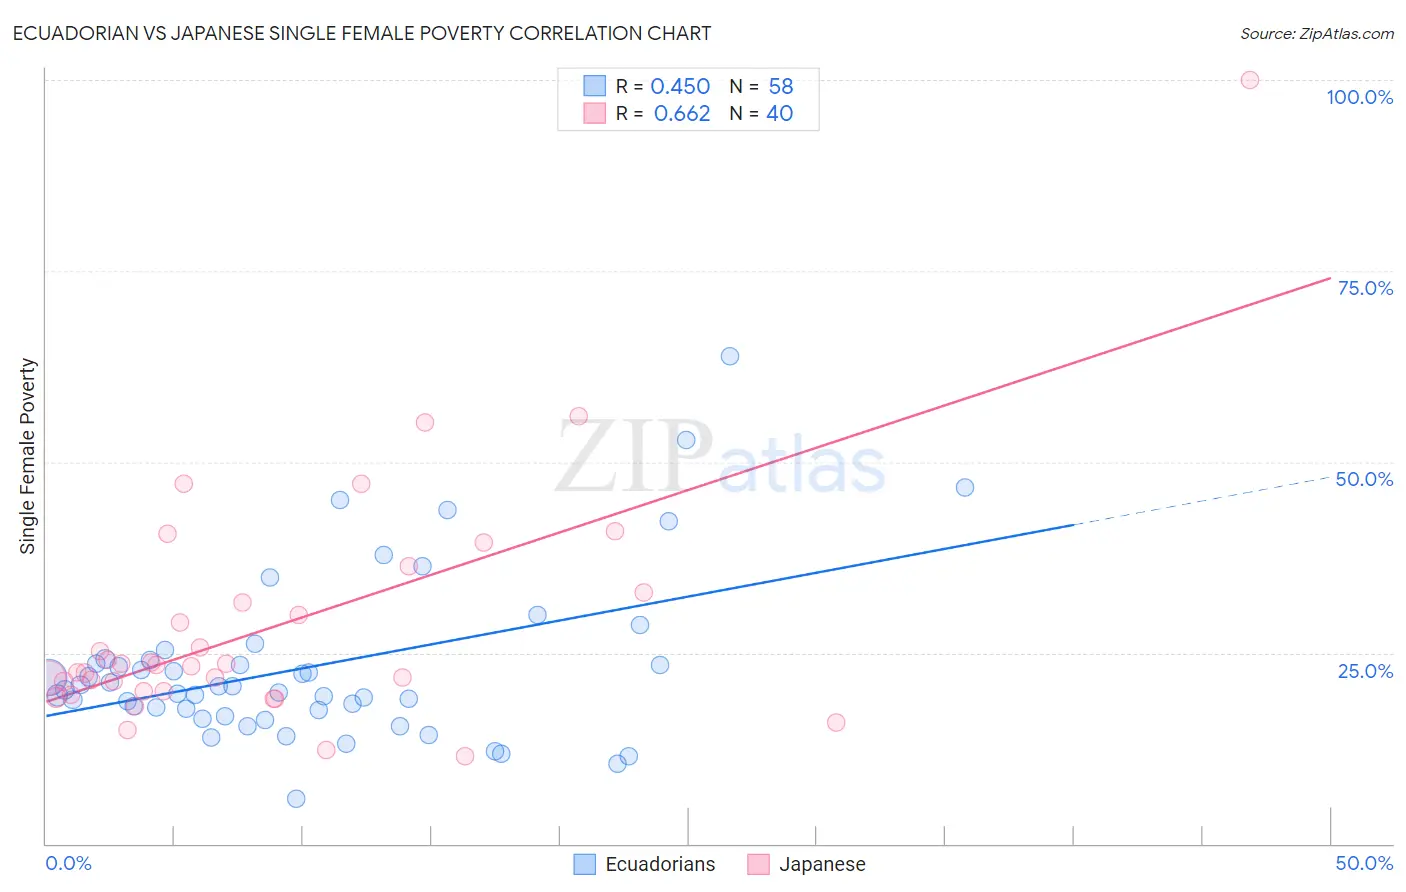
Ecuadorian vs Japanese Single Female Poverty Correlation Chart
The statistical analysis conducted on geographies consisting of 313,951,403 people shows a moderate positive correlation between the proportion of Ecuadorians and poverty level among single females in the United States with a correlation coefficient (R) of 0.450 and weighted average of 21.6%. Similarly, the statistical analysis conducted on geographies consisting of 247,508,626 people shows a significant positive correlation between the proportion of Japanese and poverty level among single females in the United States with a correlation coefficient (R) of 0.662 and weighted average of 21.3%, a difference of 1.4%.
Single Female Poverty Correlation Summary
| Measurement | Ecuadorian | Japanese |
| Minimum | 5.9% | 11.5% |
| Maximum | 63.8% | 100.0% |
| Range | 57.9% | 88.5% |
| Mean | 23.1% | 28.5% |
| Median | 20.4% | 23.4% |
| Interquartile 25% (IQ1) | 17.5% | 19.9% |
| Interquartile 75% (IQ3) | 24.0% | 32.3% |
| Interquartile Range (IQR) | 6.5% | 12.3% |
| Standard Deviation (Sample) | 10.9% | 15.9% |
| Standard Deviation (Population) | 10.8% | 15.7% |
Demographics Similar to Ecuadorians and Japanese by Single Female Poverty
In terms of single female poverty, the demographic groups most similar to Ecuadorians are Immigrants from Barbados (21.7%, a difference of 0.020%), Immigrants from Nicaragua (21.6%, a difference of 0.13%), Guamanian/Chamorro (21.6%, a difference of 0.19%), Jamaican (21.6%, a difference of 0.22%), and Icelander (21.6%, a difference of 0.23%). Similarly, the demographic groups most similar to Japanese are Immigrants from Saudi Arabia (21.3%, a difference of 0.060%), Swiss (21.4%, a difference of 0.17%), Immigrants (21.4%, a difference of 0.37%), Irish (21.4%, a difference of 0.42%), and Nigerian (21.4%, a difference of 0.47%).
| Demographics | Rating | Rank | Single Female Poverty |
| Immigrants | Saudi Arabia | 27.1 /100 | #196 | Fair 21.3% |
| Japanese | 26.4 /100 | #197 | Fair 21.3% |
| Swiss | 24.2 /100 | #198 | Fair 21.4% |
| Immigrants | Immigrants | 22.0 /100 | #199 | Fair 21.4% |
| Irish | 21.4 /100 | #200 | Fair 21.4% |
| Nigerians | 20.9 /100 | #201 | Fair 21.4% |
| Immigrants | Kenya | 20.7 /100 | #202 | Fair 21.4% |
| Immigrants | Haiti | 18.8 /100 | #203 | Poor 21.5% |
| Immigrants | Africa | 16.7 /100 | #204 | Poor 21.5% |
| Finns | 16.2 /100 | #205 | Poor 21.5% |
| Belgians | 16.1 /100 | #206 | Poor 21.5% |
| Ghanaians | 15.7 /100 | #207 | Poor 21.6% |
| Haitians | 15.4 /100 | #208 | Poor 21.6% |
| Immigrants | Eastern Africa | 15.1 /100 | #209 | Poor 21.6% |
| Immigrants | Panama | 14.4 /100 | #210 | Poor 21.6% |
| Icelanders | 14.0 /100 | #211 | Poor 21.6% |
| Jamaicans | 14.0 /100 | #212 | Poor 21.6% |
| Guamanians/Chamorros | 13.7 /100 | #213 | Poor 21.6% |
| Immigrants | Nicaragua | 13.3 /100 | #214 | Poor 21.6% |
| Ecuadorians | 12.3 /100 | #215 | Poor 21.6% |
| Immigrants | Barbados | 12.2 /100 | #216 | Poor 21.7% |