Ecuadorian vs Alaska Native Single Female Poverty
COMPARE
Ecuadorian
Alaska Native
Single Female Poverty
Single Female Poverty Comparison
Ecuadorians
Alaska Natives
21.6%
SINGLE FEMALE POVERTY
12.3/ 100
METRIC RATING
215th/ 347
METRIC RANK
23.3%
SINGLE FEMALE POVERTY
0.1/ 100
METRIC RATING
273rd/ 347
METRIC RANK
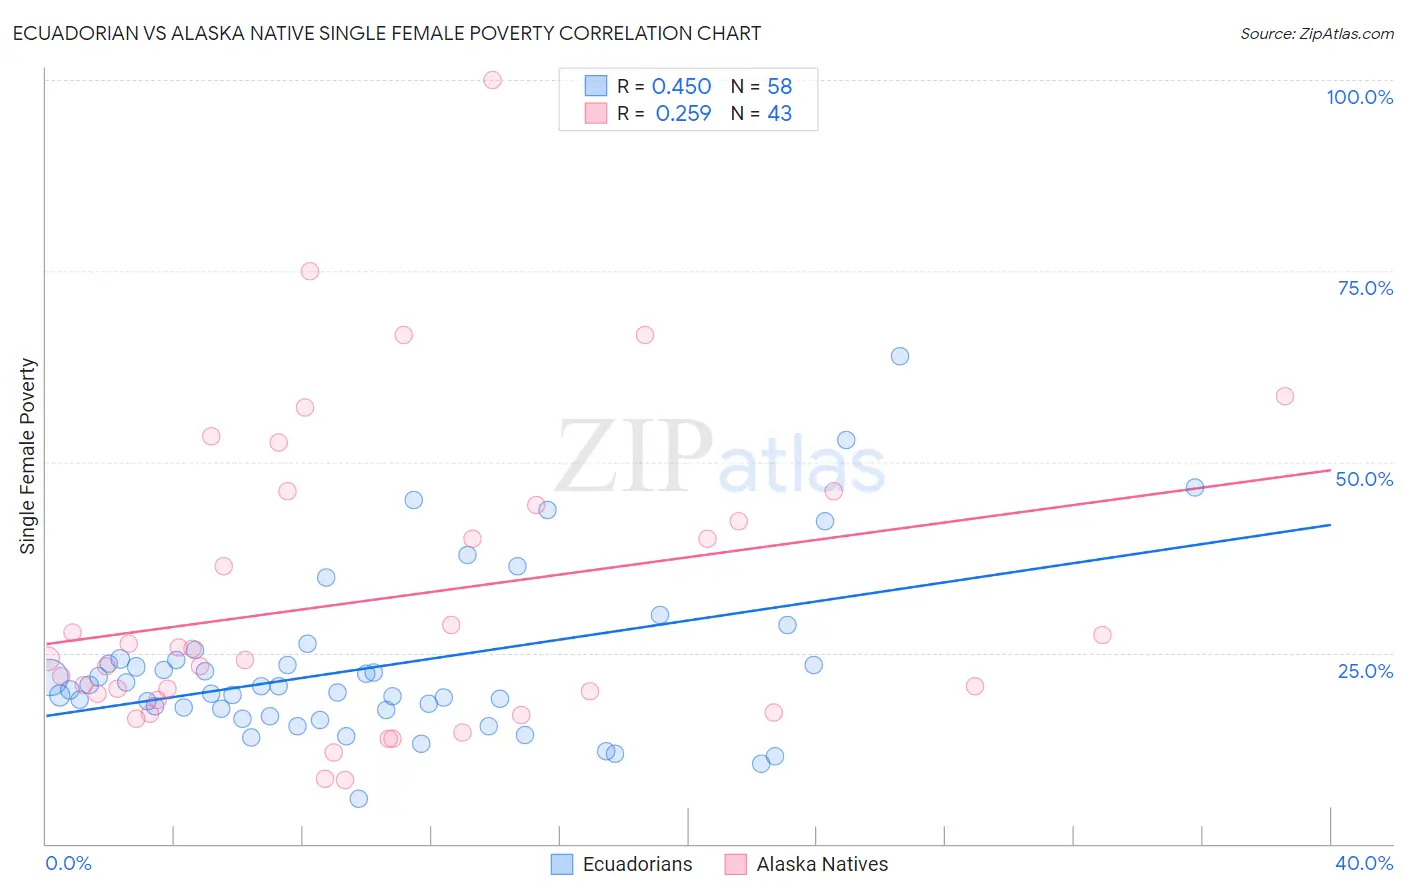
Ecuadorian vs Alaska Native Single Female Poverty Correlation Chart
The statistical analysis conducted on geographies consisting of 313,951,403 people shows a moderate positive correlation between the proportion of Ecuadorians and poverty level among single females in the United States with a correlation coefficient (R) of 0.450 and weighted average of 21.6%. Similarly, the statistical analysis conducted on geographies consisting of 76,522,237 people shows a weak positive correlation between the proportion of Alaska Natives and poverty level among single females in the United States with a correlation coefficient (R) of 0.259 and weighted average of 23.3%, a difference of 7.6%.
Single Female Poverty Correlation Summary
| Measurement | Ecuadorian | Alaska Native |
| Minimum | 5.9% | 8.3% |
| Maximum | 63.8% | 100.0% |
| Range | 57.9% | 91.7% |
| Mean | 23.1% | 32.1% |
| Median | 20.4% | 24.2% |
| Interquartile 25% (IQ1) | 17.5% | 18.8% |
| Interquartile 75% (IQ3) | 24.0% | 44.4% |
| Interquartile Range (IQR) | 6.5% | 25.6% |
| Standard Deviation (Sample) | 10.9% | 20.0% |
| Standard Deviation (Population) | 10.8% | 19.8% |
Similar Demographics by Single Female Poverty
Demographics Similar to Ecuadorians by Single Female Poverty
In terms of single female poverty, the demographic groups most similar to Ecuadorians are Immigrants from Barbados (21.7%, a difference of 0.020%), Immigrants from St. Vincent and the Grenadines (21.7%, a difference of 0.090%), Immigrants from Nicaragua (21.6%, a difference of 0.13%), Guamanian/Chamorro (21.6%, a difference of 0.19%), and Jamaican (21.6%, a difference of 0.22%).
| Demographics | Rating | Rank | Single Female Poverty |
| Haitians | 15.4 /100 | #208 | Poor 21.6% |
| Immigrants | Eastern Africa | 15.1 /100 | #209 | Poor 21.6% |
| Immigrants | Panama | 14.4 /100 | #210 | Poor 21.6% |
| Icelanders | 14.0 /100 | #211 | Poor 21.6% |
| Jamaicans | 14.0 /100 | #212 | Poor 21.6% |
| Guamanians/Chamorros | 13.7 /100 | #213 | Poor 21.6% |
| Immigrants | Nicaragua | 13.3 /100 | #214 | Poor 21.6% |
| Ecuadorians | 12.3 /100 | #215 | Poor 21.6% |
| Immigrants | Barbados | 12.2 /100 | #216 | Poor 21.7% |
| Immigrants | St. Vincent and the Grenadines | 11.7 /100 | #217 | Poor 21.7% |
| Nepalese | 9.7 /100 | #218 | Tragic 21.7% |
| Panamanians | 9.4 /100 | #219 | Tragic 21.7% |
| Germans | 8.3 /100 | #220 | Tragic 21.8% |
| Immigrants | Grenada | 8.0 /100 | #221 | Tragic 21.8% |
| Immigrants | Eritrea | 7.9 /100 | #222 | Tragic 21.8% |
Demographics Similar to Alaska Natives by Single Female Poverty
In terms of single female poverty, the demographic groups most similar to Alaska Natives are Marshallese (23.3%, a difference of 0.010%), Immigrants from Senegal (23.2%, a difference of 0.25%), Mexican American Indian (23.4%, a difference of 0.27%), Subsaharan African (23.2%, a difference of 0.44%), and Inupiat (23.1%, a difference of 0.69%).
| Demographics | Rating | Rank | Single Female Poverty |
| Immigrants | Micronesia | 0.2 /100 | #266 | Tragic 23.0% |
| Senegalese | 0.2 /100 | #267 | Tragic 23.0% |
| Fijians | 0.2 /100 | #268 | Tragic 23.1% |
| Hmong | 0.2 /100 | #269 | Tragic 23.1% |
| Inupiat | 0.2 /100 | #270 | Tragic 23.1% |
| Sub-Saharan Africans | 0.1 /100 | #271 | Tragic 23.2% |
| Immigrants | Senegal | 0.1 /100 | #272 | Tragic 23.2% |
| Alaska Natives | 0.1 /100 | #273 | Tragic 23.3% |
| Marshallese | 0.1 /100 | #274 | Tragic 23.3% |
| Mexican American Indians | 0.1 /100 | #275 | Tragic 23.4% |
| Immigrants | Azores | 0.0 /100 | #276 | Tragic 23.5% |
| Pennsylvania Germans | 0.0 /100 | #277 | Tragic 23.6% |
| Immigrants | Nonimmigrants | 0.0 /100 | #278 | Tragic 23.6% |
| Alaskan Athabascans | 0.0 /100 | #279 | Tragic 23.6% |
| Immigrants | Latin America | 0.0 /100 | #280 | Tragic 23.7% |