Dominican vs Immigrants from Turkey Married-Couple Family Poverty
COMPARE
Dominican
Immigrants from Turkey
Married-Couple Family Poverty
Married-Couple Family Poverty Comparison
Dominicans
Immigrants from Turkey
8.3%
MARRIED-COUPLE FAMILY POVERTY
0.0/ 100
METRIC RATING
332nd/ 347
METRIC RANK
4.6%
MARRIED-COUPLE FAMILY POVERTY
98.6/ 100
METRIC RATING
86th/ 347
METRIC RANK
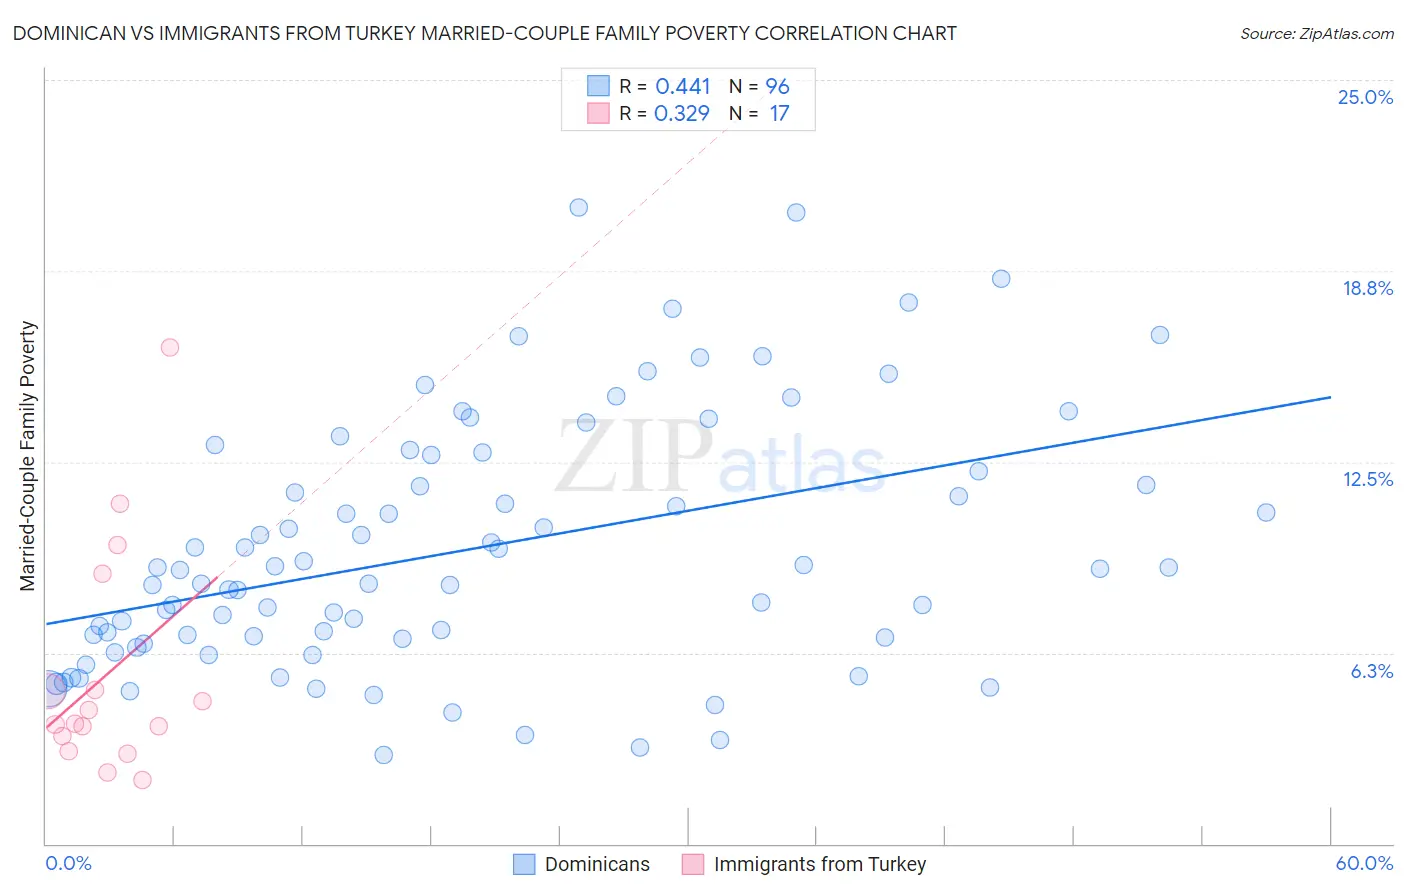
Dominican vs Immigrants from Turkey Married-Couple Family Poverty Correlation Chart
The statistical analysis conducted on geographies consisting of 351,701,155 people shows a moderate positive correlation between the proportion of Dominicans and poverty level among married-couple families in the United States with a correlation coefficient (R) of 0.441 and weighted average of 8.3%. Similarly, the statistical analysis conducted on geographies consisting of 221,764,079 people shows a mild positive correlation between the proportion of Immigrants from Turkey and poverty level among married-couple families in the United States with a correlation coefficient (R) of 0.329 and weighted average of 4.6%, a difference of 81.7%.
Married-Couple Family Poverty Correlation Summary
| Measurement | Dominican | Immigrants from Turkey |
| Minimum | 2.9% | 2.1% |
| Maximum | 20.8% | 16.2% |
| Range | 17.9% | 14.1% |
| Mean | 9.6% | 5.6% |
| Median | 9.0% | 3.9% |
| Interquartile 25% (IQ1) | 6.7% | 3.3% |
| Interquartile 75% (IQ3) | 12.5% | 6.9% |
| Interquartile Range (IQR) | 5.7% | 3.7% |
| Standard Deviation (Sample) | 4.1% | 3.8% |
| Standard Deviation (Population) | 4.1% | 3.7% |
Similar Demographics by Married-Couple Family Poverty
Demographics Similar to Dominicans by Married-Couple Family Poverty
In terms of married-couple family poverty, the demographic groups most similar to Dominicans are Central American Indian (8.3%, a difference of 0.060%), Paiute (8.3%, a difference of 0.12%), Lumbee (8.3%, a difference of 0.47%), Immigrants from Dominican Republic (8.4%, a difference of 1.1%), and Native/Alaskan (8.2%, a difference of 1.4%).
| Demographics | Rating | Rank | Married-Couple Family Poverty |
| Immigrants | Cuba | 0.0 /100 | #325 | Tragic 7.5% |
| Immigrants | Bangladesh | 0.0 /100 | #326 | Tragic 7.5% |
| Hispanics or Latinos | 0.0 /100 | #327 | Tragic 7.5% |
| Immigrants | Mexico | 0.0 /100 | #328 | Tragic 7.6% |
| Natives/Alaskans | 0.0 /100 | #329 | Tragic 8.2% |
| Paiute | 0.0 /100 | #330 | Tragic 8.3% |
| Central American Indians | 0.0 /100 | #331 | Tragic 8.3% |
| Dominicans | 0.0 /100 | #332 | Tragic 8.3% |
| Lumbee | 0.0 /100 | #333 | Tragic 8.3% |
| Immigrants | Dominican Republic | 0.0 /100 | #334 | Tragic 8.4% |
| Sioux | 0.0 /100 | #335 | Tragic 8.7% |
| Apache | 0.0 /100 | #336 | Tragic 9.0% |
| Yakama | 0.0 /100 | #337 | Tragic 9.0% |
| Cheyenne | 0.0 /100 | #338 | Tragic 9.4% |
| Crow | 0.0 /100 | #339 | Tragic 9.6% |
Demographics Similar to Immigrants from Turkey by Married-Couple Family Poverty
In terms of married-couple family poverty, the demographic groups most similar to Immigrants from Turkey are South African (4.6%, a difference of 0.040%), Immigrants from North Macedonia (4.6%, a difference of 0.080%), Bolivian (4.6%, a difference of 0.18%), Immigrants from Croatia (4.6%, a difference of 0.27%), and Immigrants from Czechoslovakia (4.6%, a difference of 0.29%).
| Demographics | Rating | Rank | Married-Couple Family Poverty |
| Immigrants | Iran | 99.0 /100 | #79 | Exceptional 4.5% |
| Icelanders | 99.0 /100 | #80 | Exceptional 4.5% |
| Immigrants | Greece | 98.9 /100 | #81 | Exceptional 4.5% |
| Canadians | 98.8 /100 | #82 | Exceptional 4.5% |
| Immigrants | Denmark | 98.8 /100 | #83 | Exceptional 4.6% |
| Immigrants | Croatia | 98.7 /100 | #84 | Exceptional 4.6% |
| South Africans | 98.7 /100 | #85 | Exceptional 4.6% |
| Immigrants | Turkey | 98.6 /100 | #86 | Exceptional 4.6% |
| Immigrants | North Macedonia | 98.6 /100 | #87 | Exceptional 4.6% |
| Bolivians | 98.6 /100 | #88 | Exceptional 4.6% |
| Immigrants | Czechoslovakia | 98.5 /100 | #89 | Exceptional 4.6% |
| Immigrants | Switzerland | 98.5 /100 | #90 | Exceptional 4.6% |
| Basques | 98.5 /100 | #91 | Exceptional 4.6% |
| Immigrants | Norway | 98.4 /100 | #92 | Exceptional 4.6% |
| Koreans | 98.3 /100 | #93 | Exceptional 4.6% |