Dominican vs Immigrants from Turkey Single Mother Poverty
COMPARE
Dominican
Immigrants from Turkey
Single Mother Poverty
Single Mother Poverty Comparison
Dominicans
Immigrants from Turkey
34.5%
SINGLE MOTHER POVERTY
0.0/ 100
METRIC RATING
316th/ 347
METRIC RANK
27.3%
SINGLE MOTHER POVERTY
99.5/ 100
METRIC RATING
65th/ 347
METRIC RANK
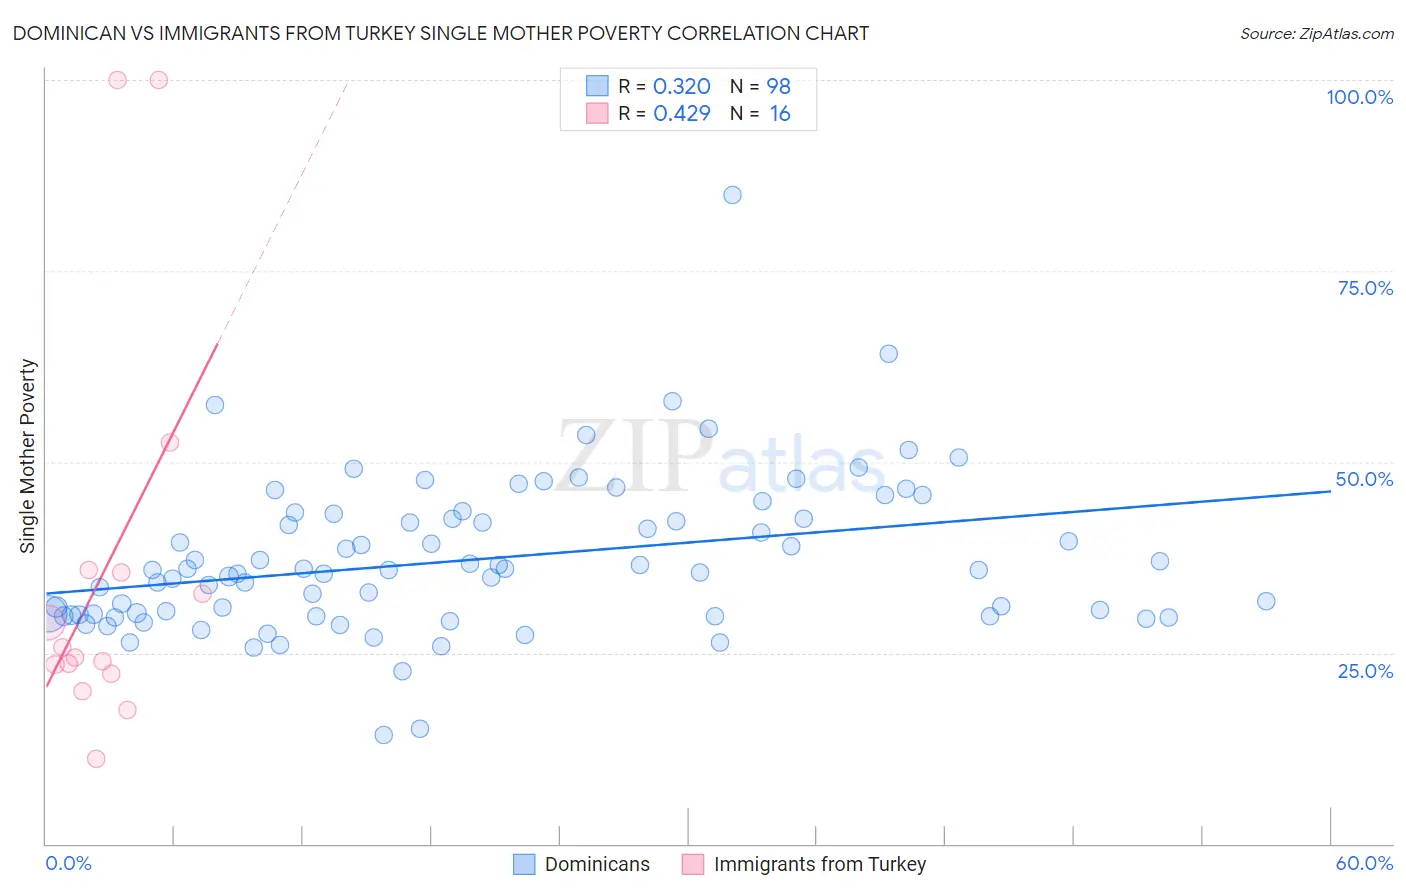
Dominican vs Immigrants from Turkey Single Mother Poverty Correlation Chart
The statistical analysis conducted on geographies consisting of 347,165,672 people shows a mild positive correlation between the proportion of Dominicans and poverty level among single mothers in the United States with a correlation coefficient (R) of 0.320 and weighted average of 34.5%. Similarly, the statistical analysis conducted on geographies consisting of 218,733,554 people shows a moderate positive correlation between the proportion of Immigrants from Turkey and poverty level among single mothers in the United States with a correlation coefficient (R) of 0.429 and weighted average of 27.3%, a difference of 26.2%.
Single Mother Poverty Correlation Summary
| Measurement | Dominican | Immigrants from Turkey |
| Minimum | 14.2% | 11.1% |
| Maximum | 84.9% | 100.0% |
| Range | 70.7% | 88.9% |
| Mean | 37.2% | 36.1% |
| Median | 35.8% | 25.0% |
| Interquartile 25% (IQ1) | 30.0% | 22.8% |
| Interquartile 75% (IQ3) | 42.5% | 35.6% |
| Interquartile Range (IQR) | 12.6% | 12.8% |
| Standard Deviation (Sample) | 10.2% | 26.6% |
| Standard Deviation (Population) | 10.1% | 25.8% |
Similar Demographics by Single Mother Poverty
Demographics Similar to Dominicans by Single Mother Poverty
In terms of single mother poverty, the demographic groups most similar to Dominicans are Cherokee (34.5%, a difference of 0.11%), Hopi (34.5%, a difference of 0.12%), Chickasaw (34.4%, a difference of 0.20%), Immigrants from Dominican Republic (34.4%, a difference of 0.37%), and Central American Indian (34.3%, a difference of 0.45%).
| Demographics | Rating | Rank | Single Mother Poverty |
| Potawatomi | 0.0 /100 | #309 | Tragic 34.1% |
| Hondurans | 0.0 /100 | #310 | Tragic 34.2% |
| Alsatians | 0.0 /100 | #311 | Tragic 34.3% |
| Central American Indians | 0.0 /100 | #312 | Tragic 34.3% |
| Immigrants | Dominican Republic | 0.0 /100 | #313 | Tragic 34.4% |
| Chickasaw | 0.0 /100 | #314 | Tragic 34.4% |
| Hopi | 0.0 /100 | #315 | Tragic 34.5% |
| Dominicans | 0.0 /100 | #316 | Tragic 34.5% |
| Cherokee | 0.0 /100 | #317 | Tragic 34.5% |
| Immigrants | Honduras | 0.0 /100 | #318 | Tragic 34.7% |
| Chippewa | 0.0 /100 | #319 | Tragic 34.8% |
| Iroquois | 0.0 /100 | #320 | Tragic 34.8% |
| Paiute | 0.0 /100 | #321 | Tragic 35.1% |
| Blacks/African Americans | 0.0 /100 | #322 | Tragic 35.2% |
| Kiowa | 0.0 /100 | #323 | Tragic 35.5% |
Demographics Similar to Immigrants from Turkey by Single Mother Poverty
In terms of single mother poverty, the demographic groups most similar to Immigrants from Turkey are Soviet Union (27.3%, a difference of 0.040%), Immigrants from Australia (27.3%, a difference of 0.060%), Russian (27.3%, a difference of 0.080%), Immigrants from Czechoslovakia (27.4%, a difference of 0.090%), and Immigrants from Northern Europe (27.3%, a difference of 0.11%).
| Demographics | Rating | Rank | Single Mother Poverty |
| Argentineans | 99.6 /100 | #58 | Exceptional 27.2% |
| Paraguayans | 99.6 /100 | #59 | Exceptional 27.2% |
| Eastern Europeans | 99.6 /100 | #60 | Exceptional 27.2% |
| Immigrants | Eastern Europe | 99.6 /100 | #61 | Exceptional 27.2% |
| Immigrants | Malaysia | 99.5 /100 | #62 | Exceptional 27.3% |
| Immigrants | Northern Europe | 99.5 /100 | #63 | Exceptional 27.3% |
| Russians | 99.5 /100 | #64 | Exceptional 27.3% |
| Immigrants | Turkey | 99.5 /100 | #65 | Exceptional 27.3% |
| Soviet Union | 99.5 /100 | #66 | Exceptional 27.3% |
| Immigrants | Australia | 99.5 /100 | #67 | Exceptional 27.3% |
| Immigrants | Czechoslovakia | 99.5 /100 | #68 | Exceptional 27.4% |
| Lithuanians | 99.4 /100 | #69 | Exceptional 27.4% |
| Immigrants | Belarus | 99.4 /100 | #70 | Exceptional 27.4% |
| Macedonians | 99.4 /100 | #71 | Exceptional 27.4% |
| Immigrants | Russia | 99.4 /100 | #72 | Exceptional 27.4% |