Danish vs Pennsylvania German Female Poverty
COMPARE
Danish
Pennsylvania German
Female Poverty
Female Poverty Comparison
Danes
Pennsylvania Germans
11.7%
FEMALE POVERTY
99.5/ 100
METRIC RATING
32nd/ 347
METRIC RANK
13.2%
FEMALE POVERTY
67.3/ 100
METRIC RATING
158th/ 347
METRIC RANK
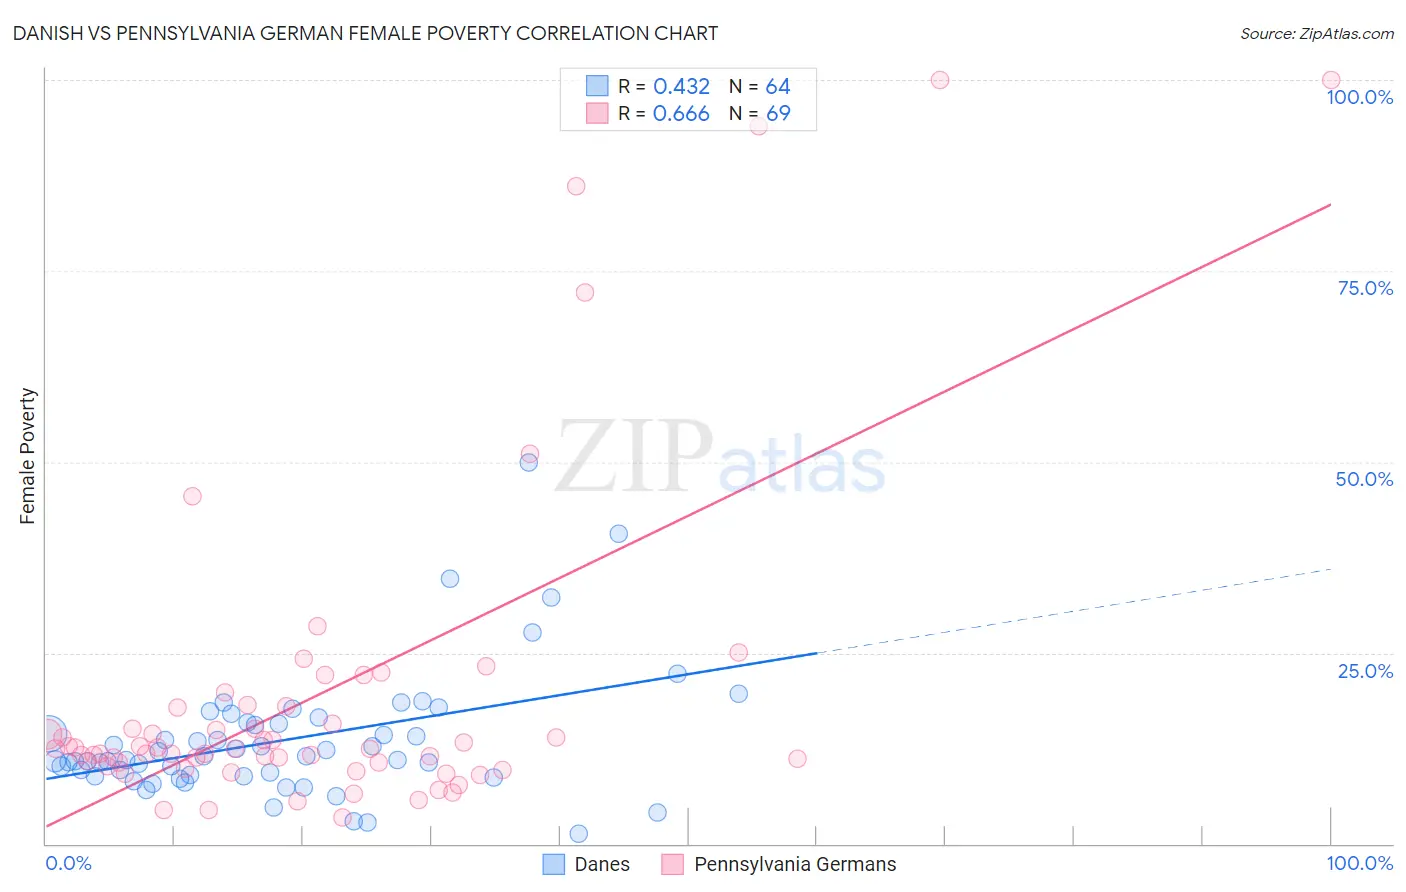
Danish vs Pennsylvania German Female Poverty Correlation Chart
The statistical analysis conducted on geographies consisting of 473,673,857 people shows a moderate positive correlation between the proportion of Danes and poverty level among females in the United States with a correlation coefficient (R) of 0.432 and weighted average of 11.7%. Similarly, the statistical analysis conducted on geographies consisting of 233,998,353 people shows a significant positive correlation between the proportion of Pennsylvania Germans and poverty level among females in the United States with a correlation coefficient (R) of 0.666 and weighted average of 13.2%, a difference of 12.5%.
Female Poverty Correlation Summary
| Measurement | Danish | Pennsylvania German |
| Minimum | 1.4% | 3.4% |
| Maximum | 50.0% | 100.0% |
| Range | 48.6% | 96.6% |
| Mean | 13.5% | 19.5% |
| Median | 11.2% | 12.4% |
| Interquartile 25% (IQ1) | 8.9% | 10.4% |
| Interquartile 75% (IQ3) | 15.8% | 17.9% |
| Interquartile Range (IQR) | 6.9% | 7.5% |
| Standard Deviation (Sample) | 8.4% | 21.6% |
| Standard Deviation (Population) | 8.3% | 21.5% |
Similar Demographics by Female Poverty
Demographics Similar to Danes by Female Poverty
In terms of female poverty, the demographic groups most similar to Danes are Cypriot (11.8%, a difference of 0.070%), Polish (11.7%, a difference of 0.13%), Immigrants from Singapore (11.8%, a difference of 0.19%), Greek (11.7%, a difference of 0.35%), and Immigrants from Iran (11.8%, a difference of 0.36%).
| Demographics | Rating | Rank | Female Poverty |
| Immigrants | Northern Europe | 99.6 /100 | #25 | Exceptional 11.6% |
| Croatians | 99.6 /100 | #26 | Exceptional 11.6% |
| Iranians | 99.6 /100 | #27 | Exceptional 11.7% |
| Immigrants | Korea | 99.6 /100 | #28 | Exceptional 11.7% |
| Immigrants | North Macedonia | 99.6 /100 | #29 | Exceptional 11.7% |
| Greeks | 99.5 /100 | #30 | Exceptional 11.7% |
| Poles | 99.5 /100 | #31 | Exceptional 11.7% |
| Danes | 99.5 /100 | #32 | Exceptional 11.7% |
| Cypriots | 99.5 /100 | #33 | Exceptional 11.8% |
| Immigrants | Singapore | 99.4 /100 | #34 | Exceptional 11.8% |
| Immigrants | Iran | 99.4 /100 | #35 | Exceptional 11.8% |
| Immigrants | Pakistan | 99.4 /100 | #36 | Exceptional 11.8% |
| Immigrants | Greece | 99.3 /100 | #37 | Exceptional 11.8% |
| Russians | 99.3 /100 | #38 | Exceptional 11.8% |
| Immigrants | Poland | 99.3 /100 | #39 | Exceptional 11.8% |
Demographics Similar to Pennsylvania Germans by Female Poverty
In terms of female poverty, the demographic groups most similar to Pennsylvania Germans are Immigrants from Northern Africa (13.2%, a difference of 0.17%), Immigrants from Bosnia and Herzegovina (13.2%, a difference of 0.27%), Hungarian (13.2%, a difference of 0.32%), Armenian (13.2%, a difference of 0.36%), and Costa Rican (13.3%, a difference of 0.41%).
| Demographics | Rating | Rank | Female Poverty |
| Immigrants | Germany | 74.9 /100 | #151 | Good 13.1% |
| Samoans | 73.6 /100 | #152 | Good 13.1% |
| Immigrants | Fiji | 71.0 /100 | #153 | Good 13.2% |
| Armenians | 70.4 /100 | #154 | Good 13.2% |
| Hungarians | 70.1 /100 | #155 | Good 13.2% |
| Immigrants | Bosnia and Herzegovina | 69.7 /100 | #156 | Good 13.2% |
| Immigrants | Northern Africa | 68.8 /100 | #157 | Good 13.2% |
| Pennsylvania Germans | 67.3 /100 | #158 | Good 13.2% |
| Costa Ricans | 63.6 /100 | #159 | Good 13.3% |
| Immigrants | Nepal | 62.7 /100 | #160 | Good 13.3% |
| Immigrants | Ethiopia | 62.5 /100 | #161 | Good 13.3% |
| Guamanians/Chamorros | 62.4 /100 | #162 | Good 13.3% |
| Immigrants | Albania | 62.4 /100 | #163 | Good 13.3% |
| Ethiopians | 62.3 /100 | #164 | Good 13.3% |
| Scotch-Irish | 62.1 /100 | #165 | Good 13.3% |