Danish vs Senegalese Female Poverty
COMPARE
Danish
Senegalese
Female Poverty
Female Poverty Comparison
Danes
Senegalese
11.7%
FEMALE POVERTY
99.5/ 100
METRIC RATING
32nd/ 347
METRIC RANK
16.5%
FEMALE POVERTY
0.0/ 100
METRIC RATING
295th/ 347
METRIC RANK
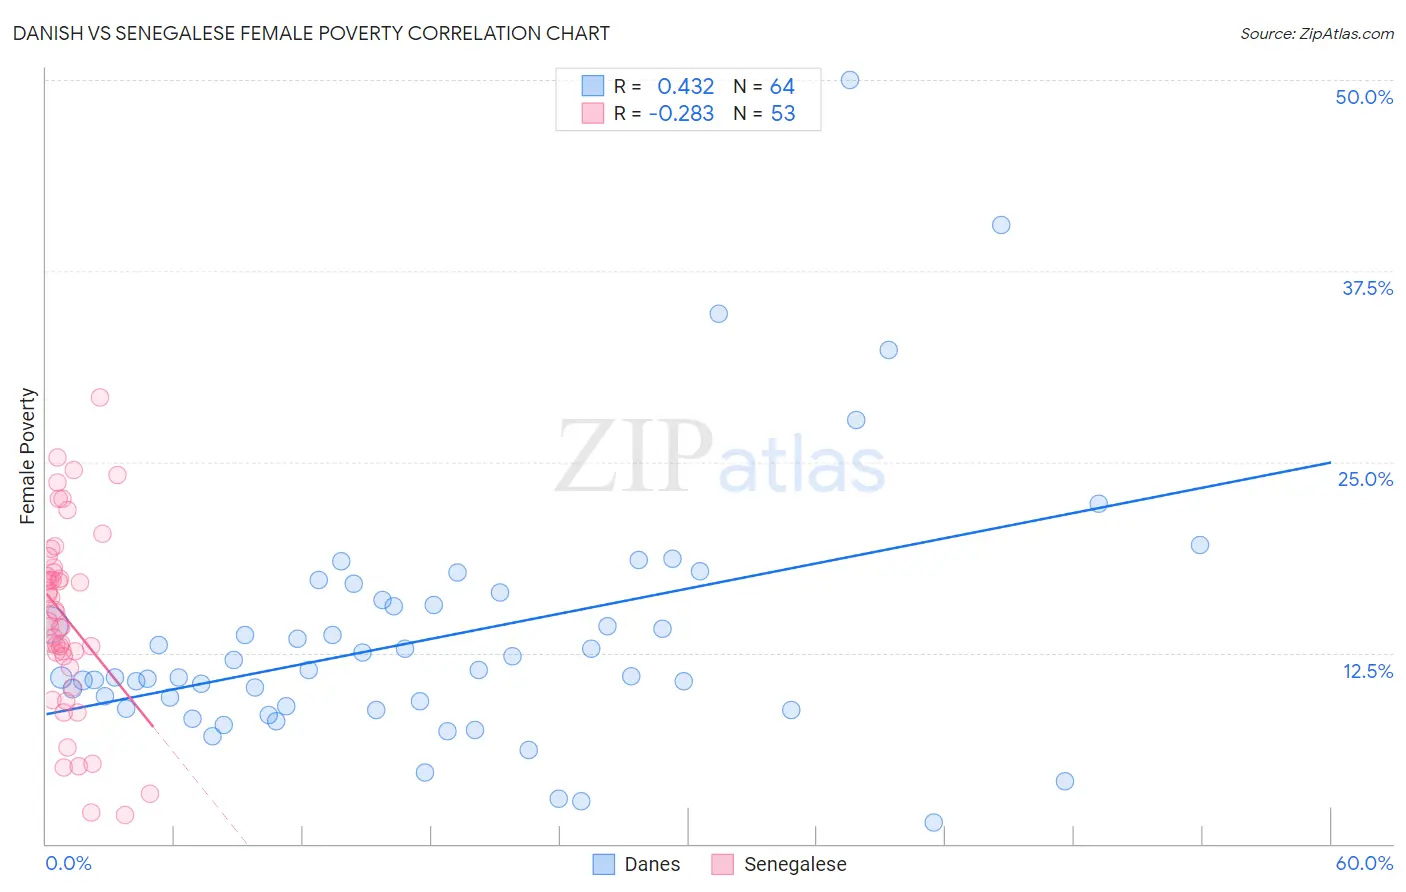
Danish vs Senegalese Female Poverty Correlation Chart
The statistical analysis conducted on geographies consisting of 473,673,857 people shows a moderate positive correlation between the proportion of Danes and poverty level among females in the United States with a correlation coefficient (R) of 0.432 and weighted average of 11.7%. Similarly, the statistical analysis conducted on geographies consisting of 78,099,565 people shows a weak negative correlation between the proportion of Senegalese and poverty level among females in the United States with a correlation coefficient (R) of -0.283 and weighted average of 16.5%, a difference of 40.1%.
Female Poverty Correlation Summary
| Measurement | Danish | Senegalese |
| Minimum | 1.4% | 1.9% |
| Maximum | 50.0% | 29.2% |
| Range | 48.6% | 27.3% |
| Mean | 13.5% | 14.7% |
| Median | 11.2% | 14.5% |
| Interquartile 25% (IQ1) | 8.9% | 11.9% |
| Interquartile 75% (IQ3) | 15.8% | 17.9% |
| Interquartile Range (IQR) | 6.9% | 6.0% |
| Standard Deviation (Sample) | 8.4% | 6.1% |
| Standard Deviation (Population) | 8.3% | 6.0% |
Similar Demographics by Female Poverty
Demographics Similar to Danes by Female Poverty
In terms of female poverty, the demographic groups most similar to Danes are Cypriot (11.8%, a difference of 0.070%), Polish (11.7%, a difference of 0.13%), Immigrants from Singapore (11.8%, a difference of 0.19%), Greek (11.7%, a difference of 0.35%), and Immigrants from Iran (11.8%, a difference of 0.36%).
| Demographics | Rating | Rank | Female Poverty |
| Immigrants | Northern Europe | 99.6 /100 | #25 | Exceptional 11.6% |
| Croatians | 99.6 /100 | #26 | Exceptional 11.6% |
| Iranians | 99.6 /100 | #27 | Exceptional 11.7% |
| Immigrants | Korea | 99.6 /100 | #28 | Exceptional 11.7% |
| Immigrants | North Macedonia | 99.6 /100 | #29 | Exceptional 11.7% |
| Greeks | 99.5 /100 | #30 | Exceptional 11.7% |
| Poles | 99.5 /100 | #31 | Exceptional 11.7% |
| Danes | 99.5 /100 | #32 | Exceptional 11.7% |
| Cypriots | 99.5 /100 | #33 | Exceptional 11.8% |
| Immigrants | Singapore | 99.4 /100 | #34 | Exceptional 11.8% |
| Immigrants | Iran | 99.4 /100 | #35 | Exceptional 11.8% |
| Immigrants | Pakistan | 99.4 /100 | #36 | Exceptional 11.8% |
| Immigrants | Greece | 99.3 /100 | #37 | Exceptional 11.8% |
| Russians | 99.3 /100 | #38 | Exceptional 11.8% |
| Immigrants | Poland | 99.3 /100 | #39 | Exceptional 11.8% |
Demographics Similar to Senegalese by Female Poverty
In terms of female poverty, the demographic groups most similar to Senegalese are Immigrants from Senegal (16.5%, a difference of 0.020%), Immigrants from Cabo Verde (16.4%, a difference of 0.080%), Immigrants from Latin America (16.4%, a difference of 0.11%), Immigrants from Zaire (16.4%, a difference of 0.17%), and Yaqui (16.4%, a difference of 0.18%).
| Demographics | Rating | Rank | Female Poverty |
| Indonesians | 0.0 /100 | #288 | Tragic 16.4% |
| Blackfeet | 0.0 /100 | #289 | Tragic 16.4% |
| Immigrants | Bangladesh | 0.0 /100 | #290 | Tragic 16.4% |
| Yaqui | 0.0 /100 | #291 | Tragic 16.4% |
| Immigrants | Zaire | 0.0 /100 | #292 | Tragic 16.4% |
| Immigrants | Latin America | 0.0 /100 | #293 | Tragic 16.4% |
| Immigrants | Cabo Verde | 0.0 /100 | #294 | Tragic 16.4% |
| Senegalese | 0.0 /100 | #295 | Tragic 16.5% |
| Immigrants | Senegal | 0.0 /100 | #296 | Tragic 16.5% |
| Mexicans | 0.0 /100 | #297 | Tragic 16.5% |
| Somalis | 0.0 /100 | #298 | Tragic 16.6% |
| Hispanics or Latinos | 0.0 /100 | #299 | Tragic 16.6% |
| Bahamians | 0.0 /100 | #300 | Tragic 16.6% |
| Guatemalans | 0.0 /100 | #301 | Tragic 16.7% |
| Chippewa | 0.0 /100 | #302 | Tragic 16.7% |