Immigrants from India vs Pennsylvania German Female Poverty
COMPARE
Immigrants from India
Pennsylvania German
Female Poverty
Female Poverty Comparison
Immigrants from India
Pennsylvania Germans
9.9%
FEMALE POVERTY
100.0/ 100
METRIC RATING
1st/ 347
METRIC RANK
13.2%
FEMALE POVERTY
67.3/ 100
METRIC RATING
158th/ 347
METRIC RANK
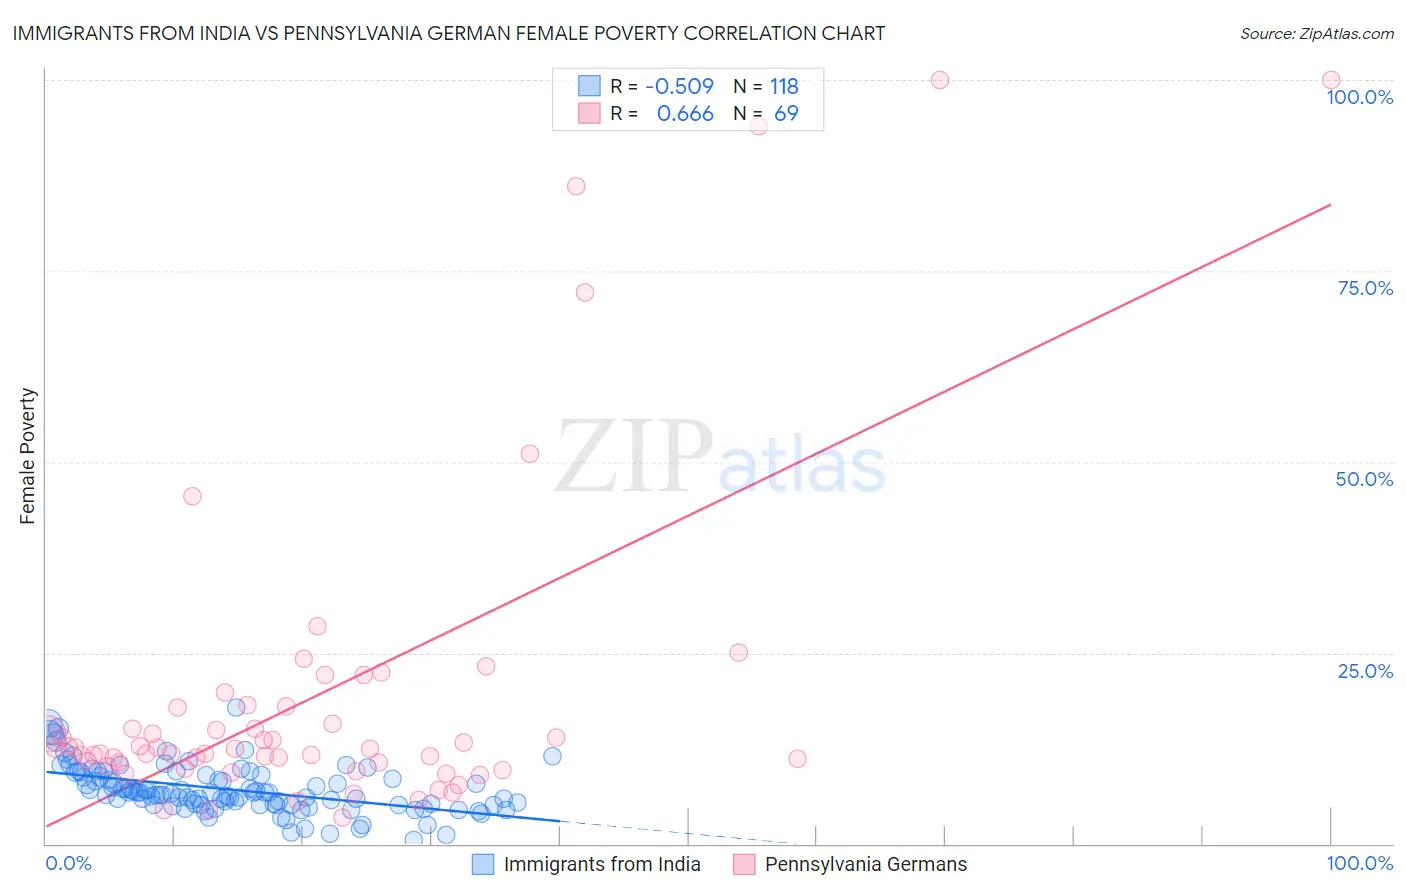
Immigrants from India vs Pennsylvania German Female Poverty Correlation Chart
The statistical analysis conducted on geographies consisting of 433,627,117 people shows a substantial negative correlation between the proportion of Immigrants from India and poverty level among females in the United States with a correlation coefficient (R) of -0.509 and weighted average of 9.9%. Similarly, the statistical analysis conducted on geographies consisting of 233,998,353 people shows a significant positive correlation between the proportion of Pennsylvania Germans and poverty level among females in the United States with a correlation coefficient (R) of 0.666 and weighted average of 13.2%, a difference of 33.7%.
Female Poverty Correlation Summary
| Measurement | Immigrants from India | Pennsylvania German |
| Minimum | 0.46% | 3.4% |
| Maximum | 17.9% | 100.0% |
| Range | 17.5% | 96.6% |
| Mean | 7.1% | 19.5% |
| Median | 6.7% | 12.4% |
| Interquartile 25% (IQ1) | 5.1% | 10.4% |
| Interquartile 75% (IQ3) | 9.0% | 17.9% |
| Interquartile Range (IQR) | 3.8% | 7.5% |
| Standard Deviation (Sample) | 3.1% | 21.6% |
| Standard Deviation (Population) | 3.1% | 21.5% |
Similar Demographics by Female Poverty
Demographics Similar to Immigrants from India by Female Poverty
In terms of female poverty, the demographic groups most similar to Immigrants from India are Chinese (10.4%, a difference of 5.2%), Thai (10.5%, a difference of 5.9%), Immigrants from Taiwan (10.5%, a difference of 6.7%), Filipino (10.9%, a difference of 10.8%), and Immigrants from Ireland (11.0%, a difference of 11.3%).
| Demographics | Rating | Rank | Female Poverty |
| Immigrants | India | 100.0 /100 | #1 | Exceptional 9.9% |
| Chinese | 100.0 /100 | #2 | Exceptional 10.4% |
| Thais | 100.0 /100 | #3 | Exceptional 10.5% |
| Immigrants | Taiwan | 100.0 /100 | #4 | Exceptional 10.5% |
| Filipinos | 100.0 /100 | #5 | Exceptional 10.9% |
| Immigrants | Ireland | 99.9 /100 | #6 | Exceptional 11.0% |
| Assyrians/Chaldeans/Syriacs | 99.9 /100 | #7 | Exceptional 11.0% |
| Immigrants | South Central Asia | 99.9 /100 | #8 | Exceptional 11.1% |
| Bulgarians | 99.9 /100 | #9 | Exceptional 11.1% |
| Immigrants | Hong Kong | 99.9 /100 | #10 | Exceptional 11.2% |
| Maltese | 99.9 /100 | #11 | Exceptional 11.2% |
| Bhutanese | 99.9 /100 | #12 | Exceptional 11.3% |
| Immigrants | Lithuania | 99.9 /100 | #13 | Exceptional 11.3% |
| Lithuanians | 99.8 /100 | #14 | Exceptional 11.4% |
| Latvians | 99.8 /100 | #15 | Exceptional 11.4% |
Demographics Similar to Pennsylvania Germans by Female Poverty
In terms of female poverty, the demographic groups most similar to Pennsylvania Germans are Immigrants from Northern Africa (13.2%, a difference of 0.17%), Immigrants from Bosnia and Herzegovina (13.2%, a difference of 0.27%), Hungarian (13.2%, a difference of 0.32%), Armenian (13.2%, a difference of 0.36%), and Costa Rican (13.3%, a difference of 0.41%).
| Demographics | Rating | Rank | Female Poverty |
| Immigrants | Germany | 74.9 /100 | #151 | Good 13.1% |
| Samoans | 73.6 /100 | #152 | Good 13.1% |
| Immigrants | Fiji | 71.0 /100 | #153 | Good 13.2% |
| Armenians | 70.4 /100 | #154 | Good 13.2% |
| Hungarians | 70.1 /100 | #155 | Good 13.2% |
| Immigrants | Bosnia and Herzegovina | 69.7 /100 | #156 | Good 13.2% |
| Immigrants | Northern Africa | 68.8 /100 | #157 | Good 13.2% |
| Pennsylvania Germans | 67.3 /100 | #158 | Good 13.2% |
| Costa Ricans | 63.6 /100 | #159 | Good 13.3% |
| Immigrants | Nepal | 62.7 /100 | #160 | Good 13.3% |
| Immigrants | Ethiopia | 62.5 /100 | #161 | Good 13.3% |
| Guamanians/Chamorros | 62.4 /100 | #162 | Good 13.3% |
| Immigrants | Albania | 62.4 /100 | #163 | Good 13.3% |
| Ethiopians | 62.3 /100 | #164 | Good 13.3% |
| Scotch-Irish | 62.1 /100 | #165 | Good 13.3% |