Danish vs Ukrainian Female Poverty
COMPARE
Danish
Ukrainian
Female Poverty
Female Poverty Comparison
Danes
Ukrainians
11.7%
FEMALE POVERTY
99.5/ 100
METRIC RATING
32nd/ 347
METRIC RANK
12.2%
FEMALE POVERTY
98.0/ 100
METRIC RATING
63rd/ 347
METRIC RANK
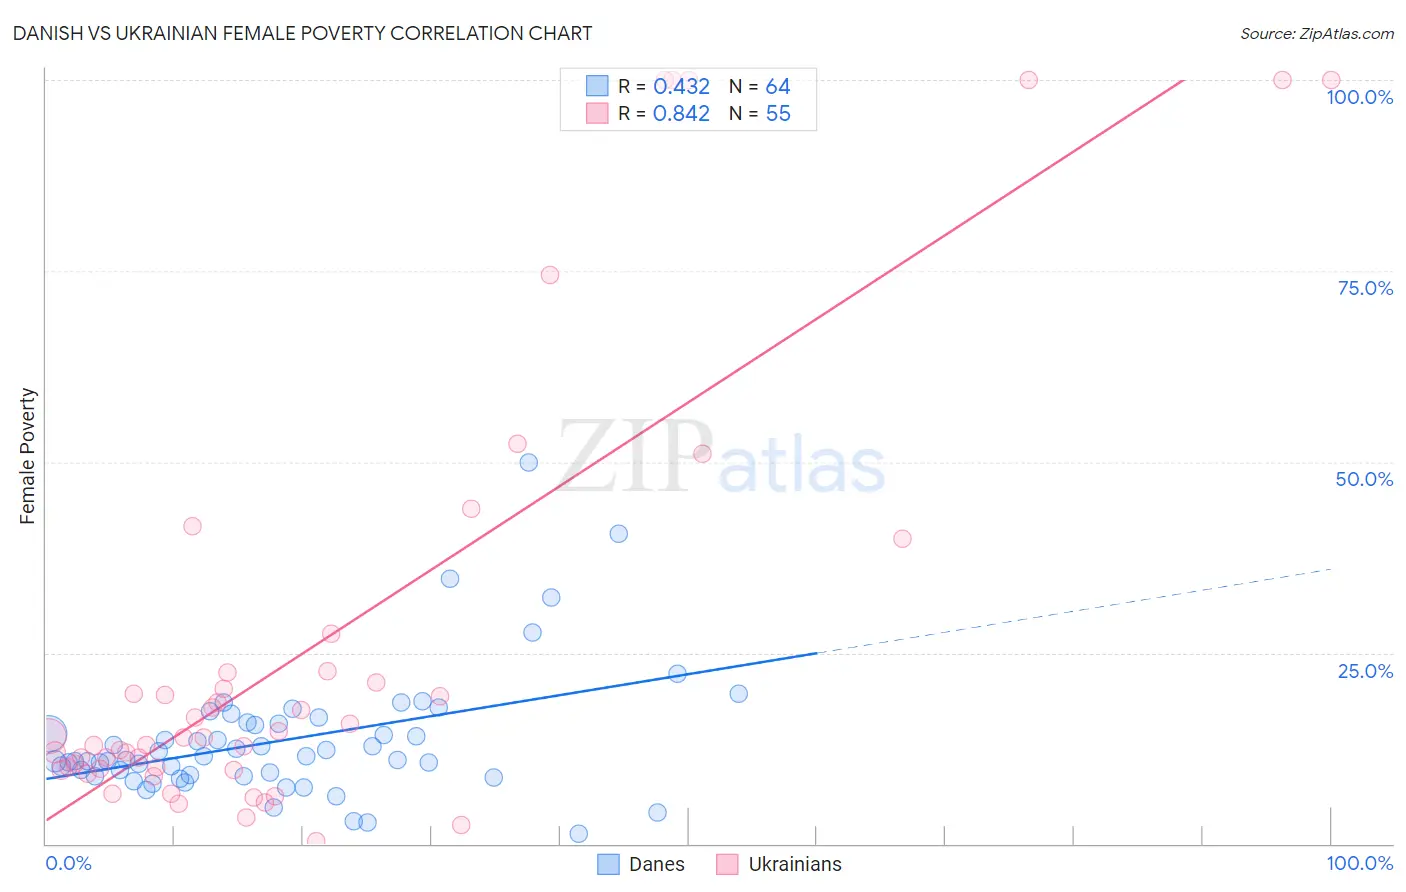
Danish vs Ukrainian Female Poverty Correlation Chart
The statistical analysis conducted on geographies consisting of 473,673,857 people shows a moderate positive correlation between the proportion of Danes and poverty level among females in the United States with a correlation coefficient (R) of 0.432 and weighted average of 11.7%. Similarly, the statistical analysis conducted on geographies consisting of 448,134,896 people shows a very strong positive correlation between the proportion of Ukrainians and poverty level among females in the United States with a correlation coefficient (R) of 0.842 and weighted average of 12.2%, a difference of 3.8%.
Female Poverty Correlation Summary
| Measurement | Danish | Ukrainian |
| Minimum | 1.4% | 0.40% |
| Maximum | 50.0% | 100.0% |
| Range | 48.6% | 99.6% |
| Mean | 13.5% | 26.3% |
| Median | 11.2% | 13.9% |
| Interquartile 25% (IQ1) | 8.9% | 9.7% |
| Interquartile 75% (IQ3) | 15.8% | 22.6% |
| Interquartile Range (IQR) | 6.9% | 12.8% |
| Standard Deviation (Sample) | 8.4% | 29.3% |
| Standard Deviation (Population) | 8.3% | 29.1% |
Similar Demographics by Female Poverty
Demographics Similar to Danes by Female Poverty
In terms of female poverty, the demographic groups most similar to Danes are Cypriot (11.8%, a difference of 0.070%), Polish (11.7%, a difference of 0.13%), Immigrants from Singapore (11.8%, a difference of 0.19%), Greek (11.7%, a difference of 0.35%), and Immigrants from Iran (11.8%, a difference of 0.36%).
| Demographics | Rating | Rank | Female Poverty |
| Immigrants | Northern Europe | 99.6 /100 | #25 | Exceptional 11.6% |
| Croatians | 99.6 /100 | #26 | Exceptional 11.6% |
| Iranians | 99.6 /100 | #27 | Exceptional 11.7% |
| Immigrants | Korea | 99.6 /100 | #28 | Exceptional 11.7% |
| Immigrants | North Macedonia | 99.6 /100 | #29 | Exceptional 11.7% |
| Greeks | 99.5 /100 | #30 | Exceptional 11.7% |
| Poles | 99.5 /100 | #31 | Exceptional 11.7% |
| Danes | 99.5 /100 | #32 | Exceptional 11.7% |
| Cypriots | 99.5 /100 | #33 | Exceptional 11.8% |
| Immigrants | Singapore | 99.4 /100 | #34 | Exceptional 11.8% |
| Immigrants | Iran | 99.4 /100 | #35 | Exceptional 11.8% |
| Immigrants | Pakistan | 99.4 /100 | #36 | Exceptional 11.8% |
| Immigrants | Greece | 99.3 /100 | #37 | Exceptional 11.8% |
| Russians | 99.3 /100 | #38 | Exceptional 11.8% |
| Immigrants | Poland | 99.3 /100 | #39 | Exceptional 11.8% |
Demographics Similar to Ukrainians by Female Poverty
In terms of female poverty, the demographic groups most similar to Ukrainians are German (12.2%, a difference of 0.030%), Indian (Asian) (12.2%, a difference of 0.060%), Austrian (12.2%, a difference of 0.070%), Immigrants from Italy (12.2%, a difference of 0.080%), and Immigrants from Asia (12.2%, a difference of 0.10%).
| Demographics | Rating | Rank | Female Poverty |
| Estonians | 98.3 /100 | #56 | Exceptional 12.1% |
| Immigrants | Serbia | 98.3 /100 | #57 | Exceptional 12.1% |
| Scandinavians | 98.2 /100 | #58 | Exceptional 12.1% |
| Immigrants | Europe | 98.2 /100 | #59 | Exceptional 12.1% |
| Immigrants | Australia | 98.1 /100 | #60 | Exceptional 12.2% |
| Immigrants | Asia | 98.1 /100 | #61 | Exceptional 12.2% |
| Immigrants | Italy | 98.0 /100 | #62 | Exceptional 12.2% |
| Ukrainians | 98.0 /100 | #63 | Exceptional 12.2% |
| Germans | 98.0 /100 | #64 | Exceptional 12.2% |
| Indians (Asian) | 97.9 /100 | #65 | Exceptional 12.2% |
| Austrians | 97.9 /100 | #66 | Exceptional 12.2% |
| Immigrants | Eastern Asia | 97.8 /100 | #67 | Exceptional 12.2% |
| Immigrants | Netherlands | 97.8 /100 | #68 | Exceptional 12.2% |
| Swiss | 97.7 /100 | #69 | Exceptional 12.2% |
| Immigrants | Belgium | 97.7 /100 | #70 | Exceptional 12.2% |