American vs Pennsylvania German Female Poverty
COMPARE
American
Pennsylvania German
Female Poverty
Female Poverty Comparison
Americans
Pennsylvania Germans
14.6%
FEMALE POVERTY
2.8/ 100
METRIC RATING
224th/ 347
METRIC RANK
13.2%
FEMALE POVERTY
67.3/ 100
METRIC RATING
158th/ 347
METRIC RANK
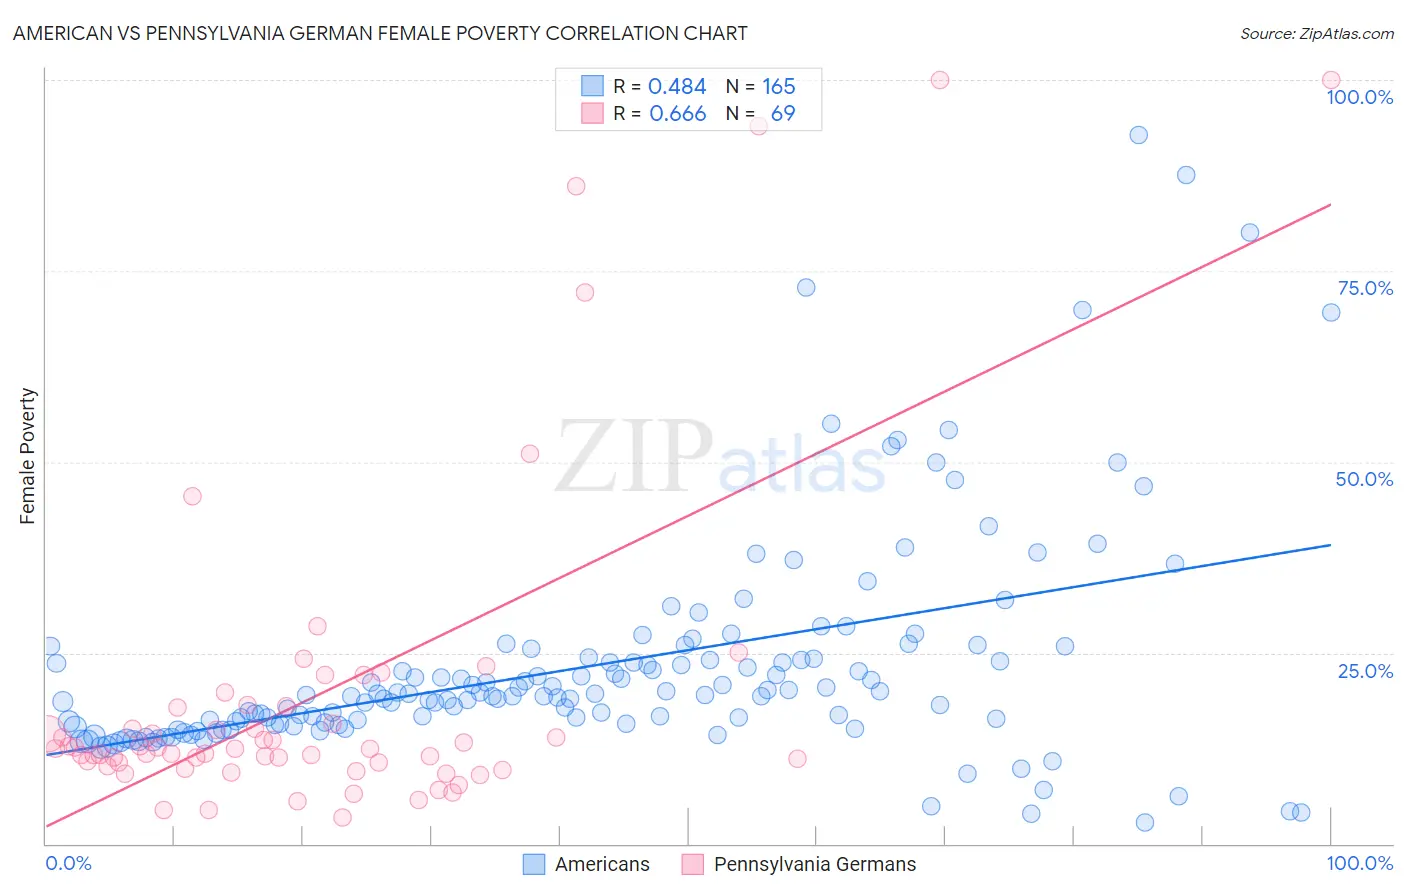
American vs Pennsylvania German Female Poverty Correlation Chart
The statistical analysis conducted on geographies consisting of 580,452,032 people shows a moderate positive correlation between the proportion of Americans and poverty level among females in the United States with a correlation coefficient (R) of 0.484 and weighted average of 14.6%. Similarly, the statistical analysis conducted on geographies consisting of 233,998,353 people shows a significant positive correlation between the proportion of Pennsylvania Germans and poverty level among females in the United States with a correlation coefficient (R) of 0.666 and weighted average of 13.2%, a difference of 10.5%.
Female Poverty Correlation Summary
| Measurement | American | Pennsylvania German |
| Minimum | 2.7% | 3.4% |
| Maximum | 92.7% | 100.0% |
| Range | 90.0% | 96.6% |
| Mean | 23.2% | 19.5% |
| Median | 19.4% | 12.4% |
| Interquartile 25% (IQ1) | 15.6% | 10.4% |
| Interquartile 75% (IQ3) | 24.2% | 17.9% |
| Interquartile Range (IQR) | 8.5% | 7.5% |
| Standard Deviation (Sample) | 14.5% | 21.6% |
| Standard Deviation (Population) | 14.5% | 21.5% |
Similar Demographics by Female Poverty
Demographics Similar to Americans by Female Poverty
In terms of female poverty, the demographic groups most similar to Americans are Immigrants from Micronesia (14.6%, a difference of 0.0%), Immigrants from Eritrea (14.6%, a difference of 0.33%), Immigrants from Africa (14.5%, a difference of 0.39%), Nonimmigrants (14.5%, a difference of 0.63%), and Immigrants from Nigeria (14.7%, a difference of 0.64%).
| Demographics | Rating | Rank | Female Poverty |
| Immigrants | Immigrants | 4.5 /100 | #217 | Tragic 14.4% |
| Immigrants | Uzbekistan | 4.4 /100 | #218 | Tragic 14.4% |
| Japanese | 4.1 /100 | #219 | Tragic 14.5% |
| Alsatians | 4.0 /100 | #220 | Tragic 14.5% |
| Immigrants | Cambodia | 3.7 /100 | #221 | Tragic 14.5% |
| Immigrants | Nonimmigrants | 3.7 /100 | #222 | Tragic 14.5% |
| Immigrants | Africa | 3.3 /100 | #223 | Tragic 14.5% |
| Americans | 2.8 /100 | #224 | Tragic 14.6% |
| Immigrants | Micronesia | 2.8 /100 | #225 | Tragic 14.6% |
| Immigrants | Eritrea | 2.4 /100 | #226 | Tragic 14.6% |
| Immigrants | Nigeria | 2.1 /100 | #227 | Tragic 14.7% |
| German Russians | 2.0 /100 | #228 | Tragic 14.7% |
| Ghanaians | 1.9 /100 | #229 | Tragic 14.7% |
| Alaska Natives | 1.8 /100 | #230 | Tragic 14.7% |
| Nigerians | 1.7 /100 | #231 | Tragic 14.8% |
Demographics Similar to Pennsylvania Germans by Female Poverty
In terms of female poverty, the demographic groups most similar to Pennsylvania Germans are Immigrants from Northern Africa (13.2%, a difference of 0.17%), Immigrants from Bosnia and Herzegovina (13.2%, a difference of 0.27%), Hungarian (13.2%, a difference of 0.32%), Armenian (13.2%, a difference of 0.36%), and Costa Rican (13.3%, a difference of 0.41%).
| Demographics | Rating | Rank | Female Poverty |
| Immigrants | Germany | 74.9 /100 | #151 | Good 13.1% |
| Samoans | 73.6 /100 | #152 | Good 13.1% |
| Immigrants | Fiji | 71.0 /100 | #153 | Good 13.2% |
| Armenians | 70.4 /100 | #154 | Good 13.2% |
| Hungarians | 70.1 /100 | #155 | Good 13.2% |
| Immigrants | Bosnia and Herzegovina | 69.7 /100 | #156 | Good 13.2% |
| Immigrants | Northern Africa | 68.8 /100 | #157 | Good 13.2% |
| Pennsylvania Germans | 67.3 /100 | #158 | Good 13.2% |
| Costa Ricans | 63.6 /100 | #159 | Good 13.3% |
| Immigrants | Nepal | 62.7 /100 | #160 | Good 13.3% |
| Immigrants | Ethiopia | 62.5 /100 | #161 | Good 13.3% |
| Guamanians/Chamorros | 62.4 /100 | #162 | Good 13.3% |
| Immigrants | Albania | 62.4 /100 | #163 | Good 13.3% |
| Ethiopians | 62.3 /100 | #164 | Good 13.3% |
| Scotch-Irish | 62.1 /100 | #165 | Good 13.3% |