Danish vs Pennsylvania German High School Diploma
COMPARE
Danish
Pennsylvania German
High School Diploma
High School Diploma Comparison
Danes
Pennsylvania Germans
91.8%
HIGH SCHOOL DIPLOMA
100.0/ 100
METRIC RATING
13th/ 347
METRIC RANK
87.0%
HIGH SCHOOL DIPLOMA
0.2/ 100
METRIC RATING
268th/ 347
METRIC RANK
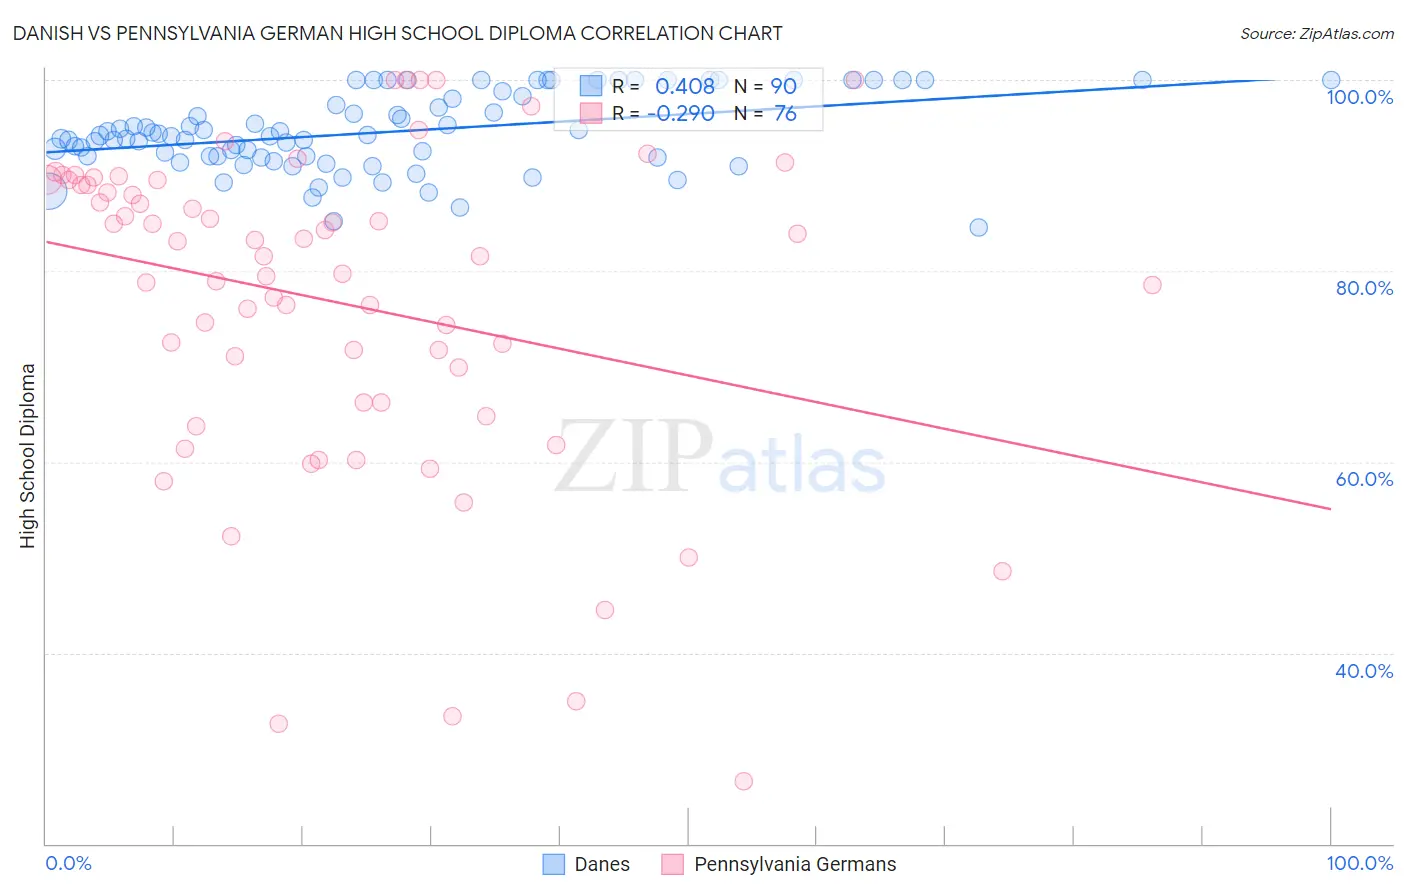
Danish vs Pennsylvania German High School Diploma Correlation Chart
The statistical analysis conducted on geographies consisting of 474,193,674 people shows a moderate positive correlation between the proportion of Danes and percentage of population with at least high school diploma education in the United States with a correlation coefficient (R) of 0.408 and weighted average of 91.8%. Similarly, the statistical analysis conducted on geographies consisting of 234,102,935 people shows a weak negative correlation between the proportion of Pennsylvania Germans and percentage of population with at least high school diploma education in the United States with a correlation coefficient (R) of -0.290 and weighted average of 87.0%, a difference of 5.5%.
High School Diploma Correlation Summary
| Measurement | Danish | Pennsylvania German |
| Minimum | 84.6% | 26.6% |
| Maximum | 100.0% | 100.0% |
| Range | 15.4% | 73.4% |
| Mean | 94.5% | 76.7% |
| Median | 94.1% | 81.5% |
| Interquartile 25% (IQ1) | 92.0% | 66.2% |
| Interquartile 75% (IQ3) | 98.3% | 89.3% |
| Interquartile Range (IQR) | 6.4% | 23.1% |
| Standard Deviation (Sample) | 4.0% | 17.0% |
| Standard Deviation (Population) | 4.0% | 16.9% |
Similar Demographics by High School Diploma
Demographics Similar to Danes by High School Diploma
In terms of high school diploma, the demographic groups most similar to Danes are Polish (91.9%, a difference of 0.050%), Bulgarian (91.8%, a difference of 0.050%), Luxembourger (91.7%, a difference of 0.080%), Eastern European (91.9%, a difference of 0.090%), and Finnish (91.7%, a difference of 0.10%).
| Demographics | Rating | Rank | High School Diploma |
| Slovaks | 100.0 /100 | #6 | Exceptional 92.0% |
| Immigrants | India | 100.0 /100 | #7 | Exceptional 92.0% |
| Chinese | 100.0 /100 | #8 | Exceptional 92.0% |
| Latvians | 100.0 /100 | #9 | Exceptional 92.0% |
| Croatians | 100.0 /100 | #10 | Exceptional 92.0% |
| Eastern Europeans | 100.0 /100 | #11 | Exceptional 91.9% |
| Poles | 100.0 /100 | #12 | Exceptional 91.9% |
| Danes | 100.0 /100 | #13 | Exceptional 91.8% |
| Bulgarians | 100.0 /100 | #14 | Exceptional 91.8% |
| Luxembourgers | 100.0 /100 | #15 | Exceptional 91.7% |
| Finns | 100.0 /100 | #16 | Exceptional 91.7% |
| Immigrants | Singapore | 99.9 /100 | #17 | Exceptional 91.7% |
| Germans | 99.9 /100 | #18 | Exceptional 91.7% |
| Maltese | 99.9 /100 | #19 | Exceptional 91.6% |
| Czechs | 99.9 /100 | #20 | Exceptional 91.6% |
Demographics Similar to Pennsylvania Germans by High School Diploma
In terms of high school diploma, the demographic groups most similar to Pennsylvania Germans are Sri Lankan (87.0%, a difference of 0.010%), Malaysian (87.0%, a difference of 0.020%), Black/African American (87.0%, a difference of 0.030%), Immigrants from Congo (87.0%, a difference of 0.050%), and West Indian (86.9%, a difference of 0.090%).
| Demographics | Rating | Rank | High School Diploma |
| Seminole | 0.4 /100 | #261 | Tragic 87.3% |
| Immigrants | Peru | 0.4 /100 | #262 | Tragic 87.3% |
| Immigrants | South Eastern Asia | 0.3 /100 | #263 | Tragic 87.2% |
| Jamaicans | 0.3 /100 | #264 | Tragic 87.2% |
| U.S. Virgin Islanders | 0.2 /100 | #265 | Tragic 87.1% |
| Immigrants | Congo | 0.2 /100 | #266 | Tragic 87.0% |
| Blacks/African Americans | 0.2 /100 | #267 | Tragic 87.0% |
| Pennsylvania Germans | 0.2 /100 | #268 | Tragic 87.0% |
| Sri Lankans | 0.2 /100 | #269 | Tragic 87.0% |
| Malaysians | 0.2 /100 | #270 | Tragic 87.0% |
| West Indians | 0.1 /100 | #271 | Tragic 86.9% |
| Trinidadians and Tobagonians | 0.1 /100 | #272 | Tragic 86.9% |
| Immigrants | Jamaica | 0.1 /100 | #273 | Tragic 86.9% |
| Bangladeshis | 0.1 /100 | #274 | Tragic 86.9% |
| Immigrants | Trinidad and Tobago | 0.1 /100 | #275 | Tragic 86.8% |