Danish vs Central American Indian Female Poverty
COMPARE
Danish
Central American Indian
Female Poverty
Female Poverty Comparison
Danes
Central American Indians
11.7%
FEMALE POVERTY
99.5/ 100
METRIC RATING
32nd/ 347
METRIC RANK
18.0%
FEMALE POVERTY
0.0/ 100
METRIC RATING
326th/ 347
METRIC RANK
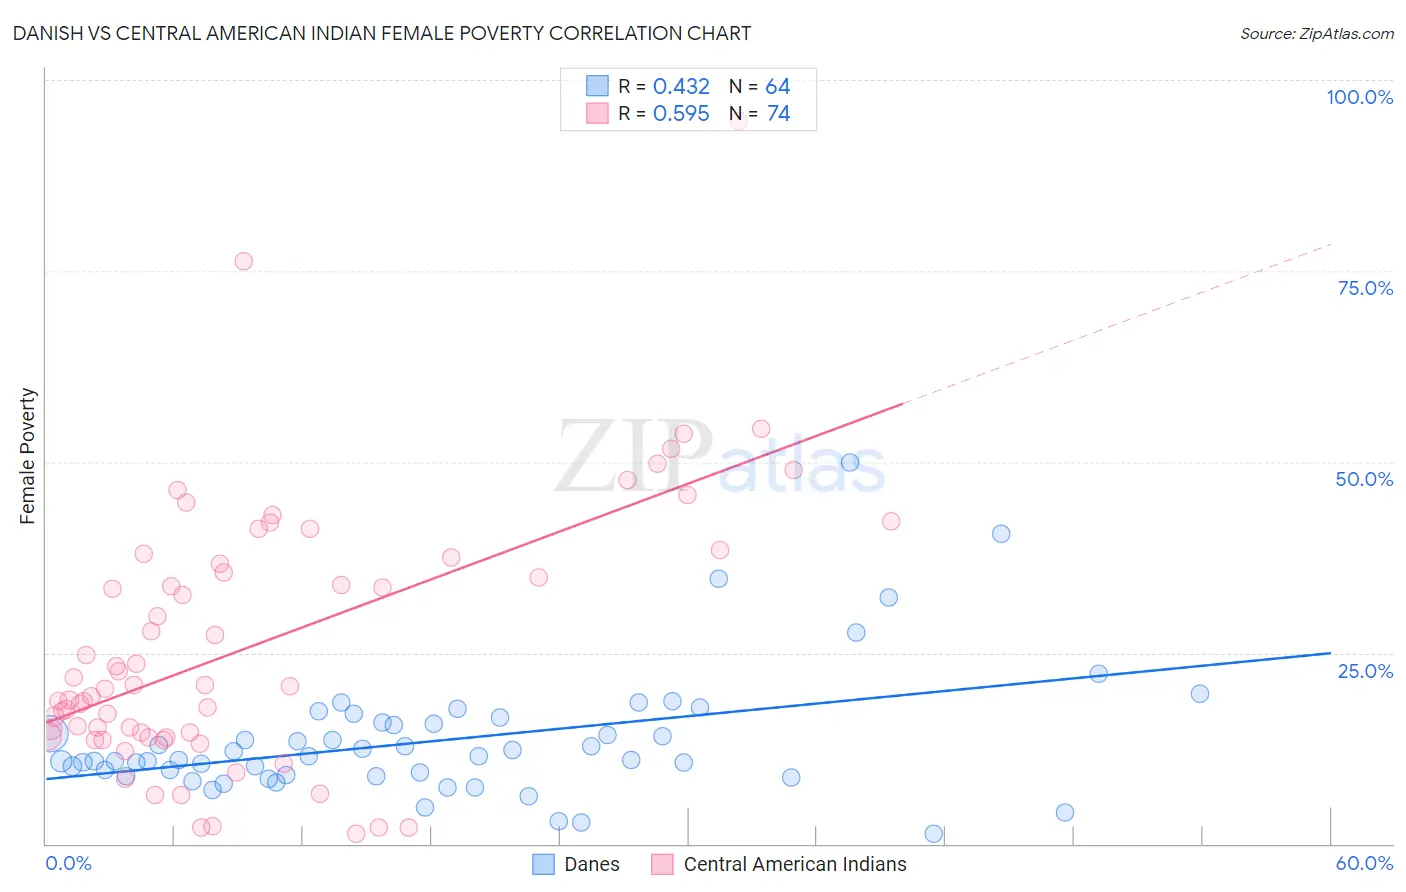
Danish vs Central American Indian Female Poverty Correlation Chart
The statistical analysis conducted on geographies consisting of 473,673,857 people shows a moderate positive correlation between the proportion of Danes and poverty level among females in the United States with a correlation coefficient (R) of 0.432 and weighted average of 11.7%. Similarly, the statistical analysis conducted on geographies consisting of 326,040,737 people shows a substantial positive correlation between the proportion of Central American Indians and poverty level among females in the United States with a correlation coefficient (R) of 0.595 and weighted average of 18.0%, a difference of 53.5%.
Female Poverty Correlation Summary
| Measurement | Danish | Central American Indian |
| Minimum | 1.4% | 1.4% |
| Maximum | 50.0% | 94.5% |
| Range | 48.6% | 93.2% |
| Mean | 13.5% | 26.1% |
| Median | 11.2% | 20.8% |
| Interquartile 25% (IQ1) | 8.9% | 14.1% |
| Interquartile 75% (IQ3) | 15.8% | 37.5% |
| Interquartile Range (IQR) | 6.9% | 23.4% |
| Standard Deviation (Sample) | 8.4% | 17.4% |
| Standard Deviation (Population) | 8.3% | 17.3% |
Similar Demographics by Female Poverty
Demographics Similar to Danes by Female Poverty
In terms of female poverty, the demographic groups most similar to Danes are Cypriot (11.8%, a difference of 0.070%), Polish (11.7%, a difference of 0.13%), Immigrants from Singapore (11.8%, a difference of 0.19%), Greek (11.7%, a difference of 0.35%), and Immigrants from Iran (11.8%, a difference of 0.36%).
| Demographics | Rating | Rank | Female Poverty |
| Immigrants | Northern Europe | 99.6 /100 | #25 | Exceptional 11.6% |
| Croatians | 99.6 /100 | #26 | Exceptional 11.6% |
| Iranians | 99.6 /100 | #27 | Exceptional 11.7% |
| Immigrants | Korea | 99.6 /100 | #28 | Exceptional 11.7% |
| Immigrants | North Macedonia | 99.6 /100 | #29 | Exceptional 11.7% |
| Greeks | 99.5 /100 | #30 | Exceptional 11.7% |
| Poles | 99.5 /100 | #31 | Exceptional 11.7% |
| Danes | 99.5 /100 | #32 | Exceptional 11.7% |
| Cypriots | 99.5 /100 | #33 | Exceptional 11.8% |
| Immigrants | Singapore | 99.4 /100 | #34 | Exceptional 11.8% |
| Immigrants | Iran | 99.4 /100 | #35 | Exceptional 11.8% |
| Immigrants | Pakistan | 99.4 /100 | #36 | Exceptional 11.8% |
| Immigrants | Greece | 99.3 /100 | #37 | Exceptional 11.8% |
| Russians | 99.3 /100 | #38 | Exceptional 11.8% |
| Immigrants | Poland | 99.3 /100 | #39 | Exceptional 11.8% |
Demographics Similar to Central American Indians by Female Poverty
In terms of female poverty, the demographic groups most similar to Central American Indians are Yakama (18.0%, a difference of 0.10%), Colville (17.8%, a difference of 1.5%), Immigrants from Honduras (17.7%, a difference of 1.7%), Paiute (17.7%, a difference of 1.9%), and Menominee (17.6%, a difference of 2.5%).
| Demographics | Rating | Rank | Female Poverty |
| Cajuns | 0.0 /100 | #319 | Tragic 17.5% |
| Immigrants | Dominica | 0.0 /100 | #320 | Tragic 17.5% |
| Arapaho | 0.0 /100 | #321 | Tragic 17.5% |
| Menominee | 0.0 /100 | #322 | Tragic 17.6% |
| Paiute | 0.0 /100 | #323 | Tragic 17.7% |
| Immigrants | Honduras | 0.0 /100 | #324 | Tragic 17.7% |
| Colville | 0.0 /100 | #325 | Tragic 17.8% |
| Central American Indians | 0.0 /100 | #326 | Tragic 18.0% |
| Yakama | 0.0 /100 | #327 | Tragic 18.0% |
| Blacks/African Americans | 0.0 /100 | #328 | Tragic 18.6% |
| Kiowa | 0.0 /100 | #329 | Tragic 18.6% |
| Dominicans | 0.0 /100 | #330 | Tragic 19.1% |
| Natives/Alaskans | 0.0 /100 | #331 | Tragic 19.2% |
| Apache | 0.0 /100 | #332 | Tragic 19.2% |
| Immigrants | Dominican Republic | 0.0 /100 | #333 | Tragic 19.3% |