Danish vs Bulgarian Female Poverty

COMPARE

Danish
Race
Ancestry
AfghanAfricanAlaska NativeAlaskan AthabascanAlbanianAleutAlsatianAmericanApacheArabArapahoArgentineanArmenianAssyrian/Chaldean/SyriacAustralianAustrianBahamianBangladeshiBarbadianBasqueBelgianBelizeanBermudanBhutaneseBlackfeetBolivianBrazilianBritishBritish West IndianBurmeseCajunCambodianCanadianCape VerdeanCarpatho RusynCelticCentral AmericanCentral American IndianCherokeeCheyenneChickasawChileanChineseChippewaChoctawColombianColvilleComancheCosta RicanCreeCreekCroatianCrowCubanCypriotCzechCzechoslovakianDanishDelawareDominicanDutchDutch West IndianEastern EuropeanEcuadorianEgyptianEnglishEstonianEthiopianEuropeanFijianFilipinoFinnishFrenchFrench American IndianFrench CanadianGermanGerman RussianGhanaianGreekGuamanian/ChamorroGuatemalanGuyaneseHaitianHmongHonduranHopiHoumaHungarianIcelanderIndian (Asian)IndonesianInupiatIranianIraqiIrishIroquoisIsraeliItalianJamaicanJapaneseJordanianKenyanKiowaKoreanLaotianLatvianLebaneseLiberianLithuanianLumbeeLuxembourgerMacedonianMalaysianMalteseMarshalleseMenomineeMexicanMexican American IndianMongolianMoroccanNative HawaiianNavajoNepaleseNew ZealanderNicaraguanNigerianNorthern EuropeanNorwegianOkinawanOsageOttawaPaiutePakistaniPalestinianPanamanianParaguayanPennsylvania GermanPeruvianPimaPolishPortuguesePotawatomiPuebloPuerto RicanPuget Sound SalishRomanianRussianSalvadoranSamoanScandinavianScotch-IrishScottishSeminoleSenegaleseSerbianShoshoneSierra LeoneanSiouxSlavicSlovakSloveneSomaliSouth AfricanSouth AmericanSouth American IndianSoviet UnionSpaniardSpanishSpanish AmericanSpanish American IndianSri LankanSubsaharan AfricanSudaneseSwedishSwissSyrianTaiwaneseThaiTlingit-HaidaTohono O'OdhamTonganTrinidadian and TobagonianTsimshianTurkishU.S. Virgin IslanderUgandanUkrainianUruguayanUteVenezuelanVietnameseWelshWest IndianYakamaYaquiYugoslavianYumanYup'ikZimbabwean
Immigration
NonimmigrantsImmigrantsAfghanistanAfricaAlbaniaArgentinaArmeniaAsiaAustraliaAustriaBahamasBangladeshBarbadosBelarusBelgiumBelizeBoliviaBosnia and HerzegovinaBrazilBulgariaBurma/MyanmarCabo VerdeCambodiaCameroonCanadaCaribbeanCentral AmericaChileChinaColombiaCongoCosta RicaCroatiaCubaCzechoslovakiaDenmarkDominicaDominican RepublicEastern AfricaEastern AsiaEastern EuropeEcuadorEgyptEl SalvadorEnglandEritreaEthiopiaEuropeFijiFranceGermanyGhanaGreeceGrenadaGuatemalaGuyanaHaitiHondurasHong KongHungaryIndiaIndonesiaIranIraqIrelandIsraelItalyJamaicaJapanJordanKazakhstanKenyaKoreaKuwaitLaosLatin AmericaLatviaLebanonLiberiaLithuaniaMalaysiaMexicoMicronesiaMiddle AfricaMoldovaMoroccoNepalNetherlandsNicaraguaNigeriaNorth AmericaNorth MacedoniaNorthern AfricaNorthern EuropeNorwayOceaniaPakistanPanamaPeruPhilippinesPolandPortugalRomaniaRussiaSaudi ArabiaScotlandSenegalSerbiaSierra LeoneSingaporeSomaliaSouth AfricaSouth AmericaSouth Central AsiaSouth Eastern AsiaSouthern EuropeSpainSri LankaSt. Vincent and the GrenadinesSudanSwedenSwitzerlandSyriaTaiwanThailandTrinidad and TobagoTurkeyUgandaUkraineUruguayUzbekistanVenezuelaVietnamWest IndiesWestern AfricaWestern AsiaWestern EuropeYemenZaireZimbabweAzores
Bulgarian
Race
Ancestry
AfghanAfricanAlaska NativeAlaskan AthabascanAlbanianAleutAlsatianAmericanApacheArabArapahoArgentineanArmenianAssyrian/Chaldean/SyriacAustralianAustrianBahamianBangladeshiBarbadianBasqueBelgianBelizeanBermudanBhutaneseBlackfeetBolivianBrazilianBritishBritish West IndianBulgarianBurmeseCajunCambodianCanadianCape VerdeanCarpatho RusynCelticCentral AmericanCentral American IndianCherokeeCheyenneChickasawChileanChineseChippewaChoctawColombianColvilleComancheCosta RicanCreeCreekCroatianCrowCubanCypriotCzechCzechoslovakianDelawareDominicanDutchDutch West IndianEastern EuropeanEcuadorianEgyptianEnglishEstonianEthiopianEuropeanFijianFilipinoFinnishFrenchFrench American IndianFrench CanadianGermanGerman RussianGhanaianGreekGuamanian/ChamorroGuatemalanGuyaneseHaitianHmongHonduranHopiHoumaHungarianIcelanderIndian (Asian)IndonesianInupiatIranianIraqiIrishIroquoisIsraeliItalianJamaicanJapaneseJordanianKenyanKiowaKoreanLaotianLatvianLebaneseLiberianLithuanianLumbeeLuxembourgerMacedonianMalaysianMalteseMarshalleseMenomineeMexicanMexican American IndianMongolianMoroccanNative HawaiianNavajoNepaleseNew ZealanderNicaraguanNigerianNorthern EuropeanNorwegianOkinawanOsageOttawaPaiutePakistaniPalestinianPanamanianParaguayanPennsylvania GermanPeruvianPimaPolishPortuguesePotawatomiPuebloPuerto RicanPuget Sound SalishRomanianRussianSalvadoranSamoanScandinavianScotch-IrishScottishSeminoleSenegaleseSerbianShoshoneSierra LeoneanSiouxSlavicSlovakSloveneSomaliSouth AfricanSouth AmericanSouth American IndianSoviet UnionSpaniardSpanishSpanish AmericanSpanish American IndianSri LankanSubsaharan AfricanSudaneseSwedishSwissSyrianTaiwaneseThaiTlingit-HaidaTohono O'OdhamTonganTrinidadian and TobagonianTsimshianTurkishU.S. Virgin IslanderUgandanUkrainianUruguayanUteVenezuelanVietnameseWelshWest IndianYakamaYaquiYugoslavianYumanYup'ikZimbabwean
Immigration
NonimmigrantsImmigrantsAfghanistanAfricaAlbaniaArgentinaArmeniaAsiaAustraliaAustriaBahamasBangladeshBarbadosBelarusBelgiumBelizeBoliviaBosnia and HerzegovinaBrazilBulgariaBurma/MyanmarCabo VerdeCambodiaCameroonCanadaCaribbeanCentral AmericaChileChinaColombiaCongoCosta RicaCroatiaCubaCzechoslovakiaDenmarkDominicaDominican RepublicEastern AfricaEastern AsiaEastern EuropeEcuadorEgyptEl SalvadorEnglandEritreaEthiopiaEuropeFijiFranceGermanyGhanaGreeceGrenadaGuatemalaGuyanaHaitiHondurasHong KongHungaryIndiaIndonesiaIranIraqIrelandIsraelItalyJamaicaJapanJordanKazakhstanKenyaKoreaKuwaitLaosLatin AmericaLatviaLebanonLiberiaLithuaniaMalaysiaMexicoMicronesiaMiddle AfricaMoldovaMoroccoNepalNetherlandsNicaraguaNigeriaNorth AmericaNorth MacedoniaNorthern AfricaNorthern EuropeNorwayOceaniaPakistanPanamaPeruPhilippinesPolandPortugalRomaniaRussiaSaudi ArabiaScotlandSenegalSerbiaSierra LeoneSingaporeSomaliaSouth AfricaSouth AmericaSouth Central AsiaSouth Eastern AsiaSouthern EuropeSpainSri LankaSt. Vincent and the GrenadinesSudanSwedenSwitzerlandSyriaTaiwanThailandTrinidad and TobagoTurkeyUgandaUkraineUruguayUzbekistanVenezuelaVietnamWest IndiesWestern AfricaWestern AsiaWestern EuropeYemenZaireZimbabweAzores
Female Poverty
Income
Poverty
Unemployment
Labor Participation
Family Structure
Vehicle Availability
Education Level
Disability

Female Poverty Comparison

Danes

Bulgarians

Exceptional
Exceptional
11.7%
FEMALE POVERTY
99.5/ 100
METRIC RATING
32nd/ 347
METRIC RANK
11.1%
FEMALE POVERTY
99.9/ 100
METRIC RATING
9th/ 347
METRIC RANK

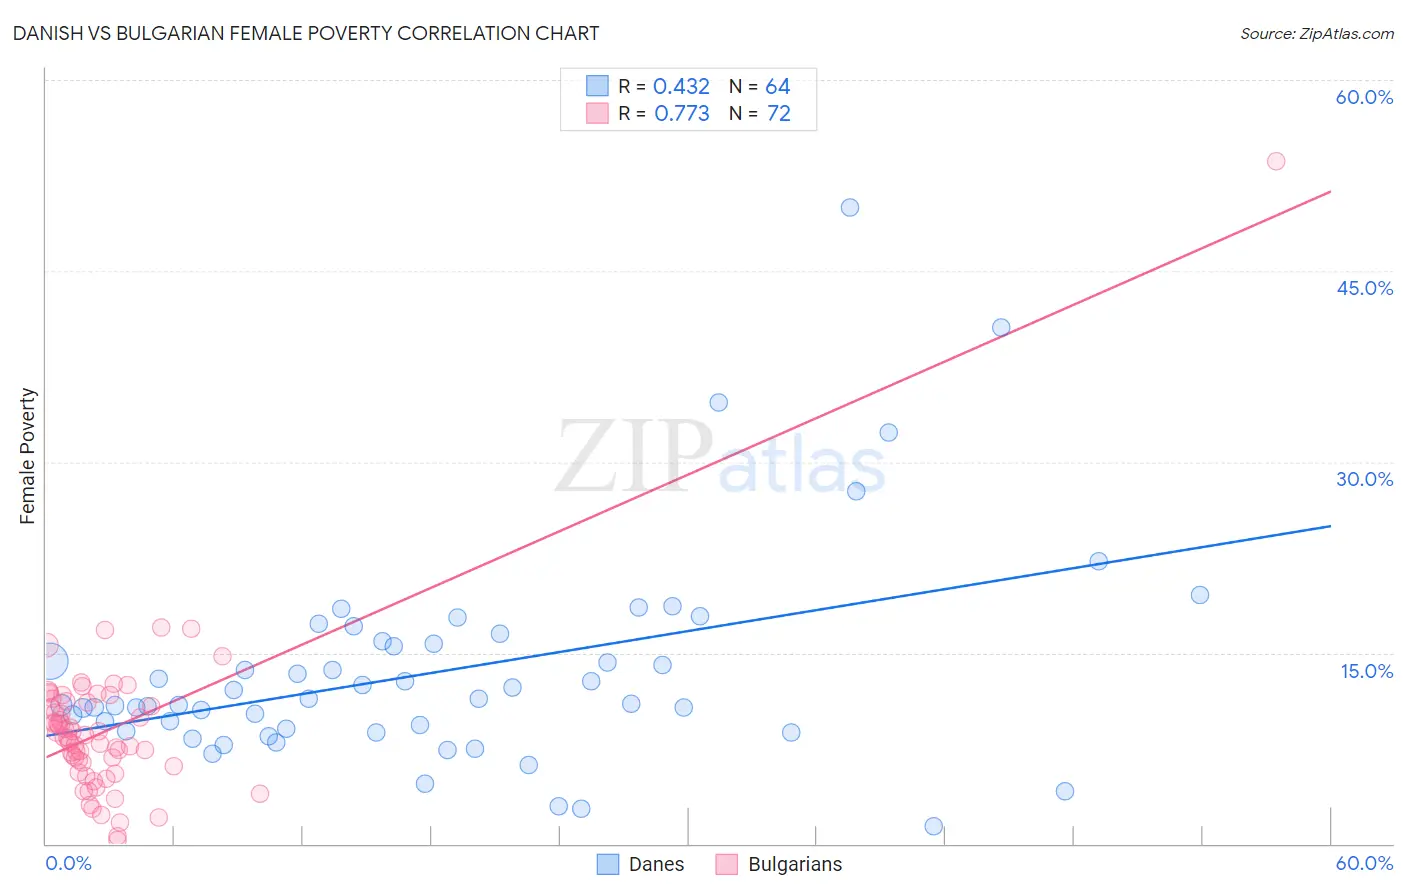
Danish vs Bulgarian Female Poverty Correlation Chart

The statistical analysis conducted on geographies consisting of 473,673,857 people shows a moderate positive correlation between the proportion of Danes and poverty level among females in the United States with a correlation coefficient (R) of 0.432 and weighted average of 11.7%. Similarly, the statistical analysis conducted on geographies consisting of 205,544,553 people shows a strong positive correlation between the proportion of Bulgarians and poverty level among females in the United States with a correlation coefficient (R) of 0.773 and weighted average of 11.1%, a difference of 5.5%.
Danish vs Bulgarian Female Poverty

Female Poverty Correlation Summary

MeasurementDanishBulgarian
Minimum1.4%0.25%
Maximum50.0%53.6%
Range48.6%53.3%
Mean13.5%9.0%
Median11.2%8.5%
Interquartile 25% (IQ1)8.9%6.2%
Interquartile 75% (IQ3)15.8%11.1%
Interquartile Range (IQR)6.9%4.9%
Standard Deviation (Sample)8.4%6.5%
Standard Deviation (Population)8.3%6.4%

Similar Demographics by Female Poverty

Demographics Similar to Danes by Female Poverty

In terms of female poverty, the demographic groups most similar to Danes are Cypriot (11.8%, a difference of 0.070%), Polish (11.7%, a difference of 0.13%), Immigrants from Singapore (11.8%, a difference of 0.19%), Greek (11.7%, a difference of 0.35%), and Immigrants from Iran (11.8%, a difference of 0.36%).
DemographicsRating | RankFemale Poverty
Immigrants | Northern Europe
99.6
/100
|
#25
Exceptional
11.6%
Croatians
99.6
/100
|
#26
Exceptional
11.6%
Iranians
99.6
/100
|
#27
Exceptional
11.7%
Immigrants | Korea
99.6
/100
|
#28
Exceptional
11.7%
Immigrants | North Macedonia
99.6
/100
|
#29
Exceptional
11.7%
Greeks
99.5
/100
|
#30
Exceptional
11.7%
Poles
99.5
/100
|
#31
Exceptional
11.7%
Danes
99.5
/100
|
#32
Exceptional
11.7%
Cypriots
99.5
/100
|
#33
Exceptional
11.8%
Immigrants | Singapore
99.4
/100
|
#34
Exceptional
11.8%
Immigrants | Iran
99.4
/100
|
#35
Exceptional
11.8%
Immigrants | Pakistan
99.4
/100
|
#36
Exceptional
11.8%
Immigrants | Greece
99.3
/100
|
#37
Exceptional
11.8%
Russians
99.3
/100
|
#38
Exceptional
11.8%
Immigrants | Poland
99.3
/100
|
#39
Exceptional
11.8%

Demographics Similar to Bulgarians by Female Poverty

In terms of female poverty, the demographic groups most similar to Bulgarians are Immigrants from South Central Asia (11.1%, a difference of 0.19%), Immigrants from Hong Kong (11.2%, a difference of 0.80%), Assyrian/Chaldean/Syriac (11.0%, a difference of 0.89%), Maltese (11.2%, a difference of 0.91%), and Immigrants from Ireland (11.0%, a difference of 1.3%).
DemographicsRating | RankFemale Poverty
Chinese
100.0
/100
|
#2
Exceptional
10.4%
Thais
100.0
/100
|
#3
Exceptional
10.5%
Immigrants | Taiwan
100.0
/100
|
#4
Exceptional
10.5%
Filipinos
100.0
/100
|
#5
Exceptional
10.9%
Immigrants | Ireland
99.9
/100
|
#6
Exceptional
11.0%
Assyrians/Chaldeans/Syriacs
99.9
/100
|
#7
Exceptional
11.0%
Immigrants | South Central Asia
99.9
/100
|
#8
Exceptional
11.1%
Bulgarians
99.9
/100
|
#9
Exceptional
11.1%
Immigrants | Hong Kong
99.9
/100
|
#10
Exceptional
11.2%
Maltese
99.9
/100
|
#11
Exceptional
11.2%
Bhutanese
99.9
/100
|
#12
Exceptional
11.3%
Immigrants | Lithuania
99.9
/100
|
#13
Exceptional
11.3%
Lithuanians
99.8
/100
|
#14
Exceptional
11.4%
Latvians
99.8
/100
|
#15
Exceptional
11.4%
Immigrants | Bolivia
99.8
/100
|
#16
Exceptional
11.5%