Zimbabwean vs Shoshone Single Male Poverty
COMPARE
Zimbabwean
Shoshone
Single Male Poverty
Single Male Poverty Comparison
Zimbabweans
Shoshone
13.1%
SINGLE MALE POVERTY
14.9/ 100
METRIC RATING
214th/ 347
METRIC RANK
16.7%
SINGLE MALE POVERTY
0.0/ 100
METRIC RATING
322nd/ 347
METRIC RANK
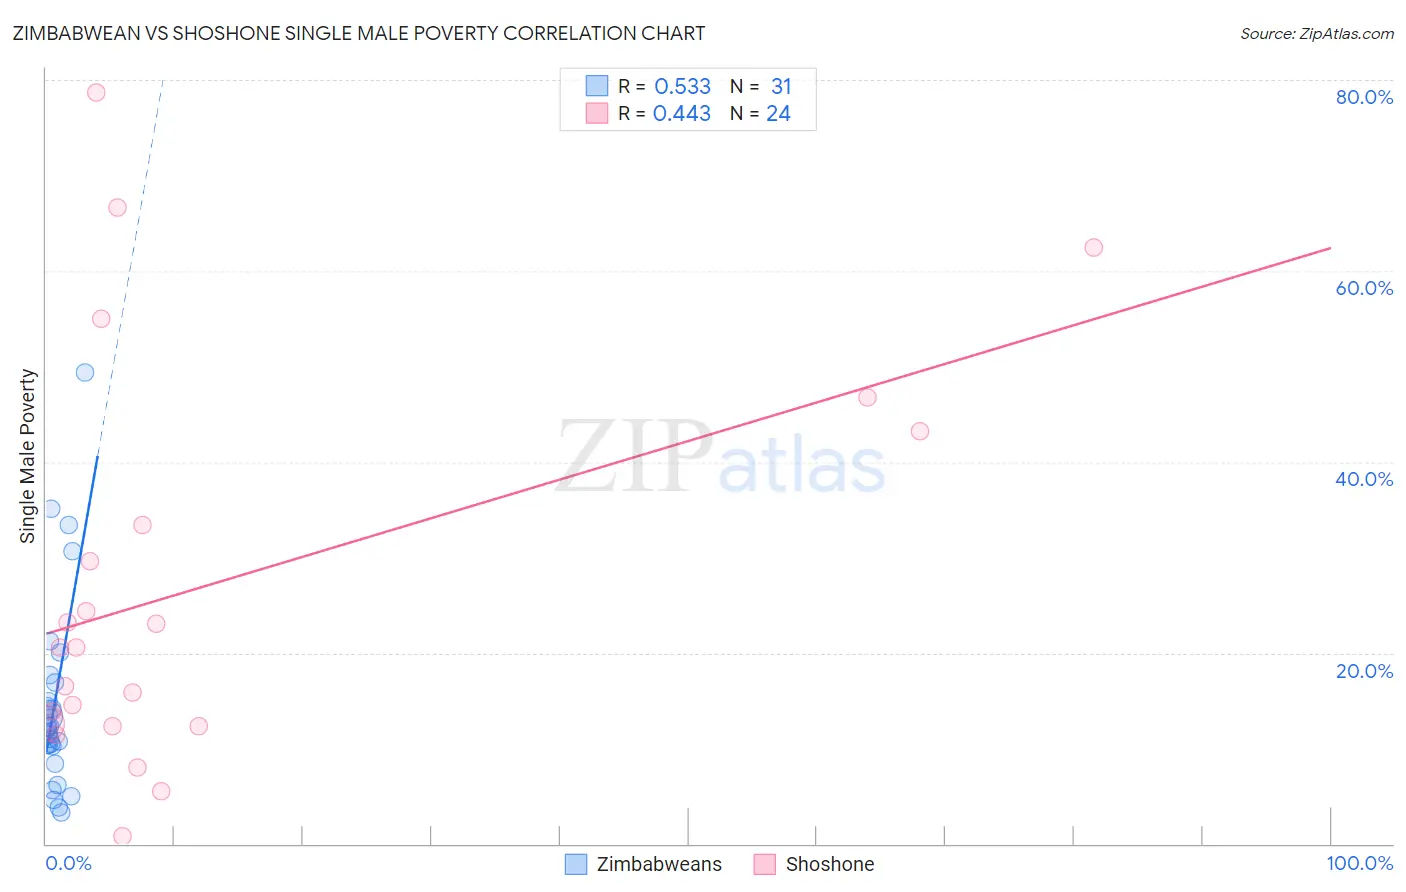
Zimbabwean vs Shoshone Single Male Poverty Correlation Chart
The statistical analysis conducted on geographies consisting of 66,821,414 people shows a substantial positive correlation between the proportion of Zimbabweans and poverty level among single males in the United States with a correlation coefficient (R) of 0.533 and weighted average of 13.1%. Similarly, the statistical analysis conducted on geographies consisting of 64,727,315 people shows a moderate positive correlation between the proportion of Shoshone and poverty level among single males in the United States with a correlation coefficient (R) of 0.443 and weighted average of 16.7%, a difference of 27.3%.
Single Male Poverty Correlation Summary
| Measurement | Zimbabwean | Shoshone |
| Minimum | 3.2% | 0.78% |
| Maximum | 49.4% | 78.7% |
| Range | 46.2% | 77.9% |
| Mean | 14.7% | 27.1% |
| Median | 12.2% | 20.6% |
| Interquartile 25% (IQ1) | 10.2% | 12.4% |
| Interquartile 75% (IQ3) | 16.9% | 38.3% |
| Interquartile Range (IQR) | 6.7% | 25.9% |
| Standard Deviation (Sample) | 10.2% | 20.9% |
| Standard Deviation (Population) | 10.0% | 20.5% |
Similar Demographics by Single Male Poverty
Demographics Similar to Zimbabweans by Single Male Poverty
In terms of single male poverty, the demographic groups most similar to Zimbabweans are Japanese (13.1%, a difference of 0.010%), Italian (13.1%, a difference of 0.090%), Austrian (13.1%, a difference of 0.10%), Senegalese (13.1%, a difference of 0.15%), and Swedish (13.1%, a difference of 0.18%).
| Demographics | Rating | Rank | Single Male Poverty |
| Sudanese | 17.7 /100 | #207 | Poor 13.1% |
| Immigrants | Western Africa | 17.6 /100 | #208 | Poor 13.1% |
| Mexican American Indians | 17.5 /100 | #209 | Poor 13.1% |
| Immigrants | Haiti | 16.8 /100 | #210 | Poor 13.1% |
| Swedes | 16.8 /100 | #211 | Poor 13.1% |
| Senegalese | 16.4 /100 | #212 | Poor 13.1% |
| Italians | 15.9 /100 | #213 | Poor 13.1% |
| Zimbabweans | 14.9 /100 | #214 | Poor 13.1% |
| Japanese | 14.8 /100 | #215 | Poor 13.1% |
| Austrians | 13.9 /100 | #216 | Poor 13.1% |
| Bermudans | 13.0 /100 | #217 | Poor 13.1% |
| Scandinavians | 12.9 /100 | #218 | Poor 13.1% |
| Immigrants | Burma/Myanmar | 12.6 /100 | #219 | Poor 13.1% |
| Central Americans | 10.9 /100 | #220 | Poor 13.2% |
| New Zealanders | 10.7 /100 | #221 | Poor 13.2% |
Demographics Similar to Shoshone by Single Male Poverty
In terms of single male poverty, the demographic groups most similar to Shoshone are Creek (16.8%, a difference of 1.0%), Immigrants from Yemen (16.9%, a difference of 1.1%), Osage (16.5%, a difference of 1.3%), Marshallese (16.4%, a difference of 1.4%), and Chippewa (16.4%, a difference of 1.9%).
| Demographics | Rating | Rank | Single Male Poverty |
| Cheyenne | 0.0 /100 | #315 | Tragic 16.1% |
| Dutch West Indians | 0.0 /100 | #316 | Tragic 16.1% |
| Blacks/African Americans | 0.0 /100 | #317 | Tragic 16.2% |
| Chickasaw | 0.0 /100 | #318 | Tragic 16.3% |
| Chippewa | 0.0 /100 | #319 | Tragic 16.4% |
| Marshallese | 0.0 /100 | #320 | Tragic 16.4% |
| Osage | 0.0 /100 | #321 | Tragic 16.5% |
| Shoshone | 0.0 /100 | #322 | Tragic 16.7% |
| Creek | 0.0 /100 | #323 | Tragic 16.8% |
| Immigrants | Yemen | 0.0 /100 | #324 | Tragic 16.9% |
| Choctaw | 0.0 /100 | #325 | Tragic 17.0% |
| Central American Indians | 0.0 /100 | #326 | Tragic 17.2% |
| Menominee | 0.0 /100 | #327 | Tragic 17.7% |
| Kiowa | 0.0 /100 | #328 | Tragic 18.3% |
| Colville | 0.0 /100 | #329 | Tragic 18.4% |