Immigrants from Belgium vs Shoshone Single Male Poverty
COMPARE
Immigrants from Belgium
Shoshone
Single Male Poverty
Single Male Poverty Comparison
Immigrants from Belgium
Shoshone
12.0%
SINGLE MALE POVERTY
99.0/ 100
METRIC RATING
79th/ 347
METRIC RANK
16.7%
SINGLE MALE POVERTY
0.0/ 100
METRIC RATING
322nd/ 347
METRIC RANK
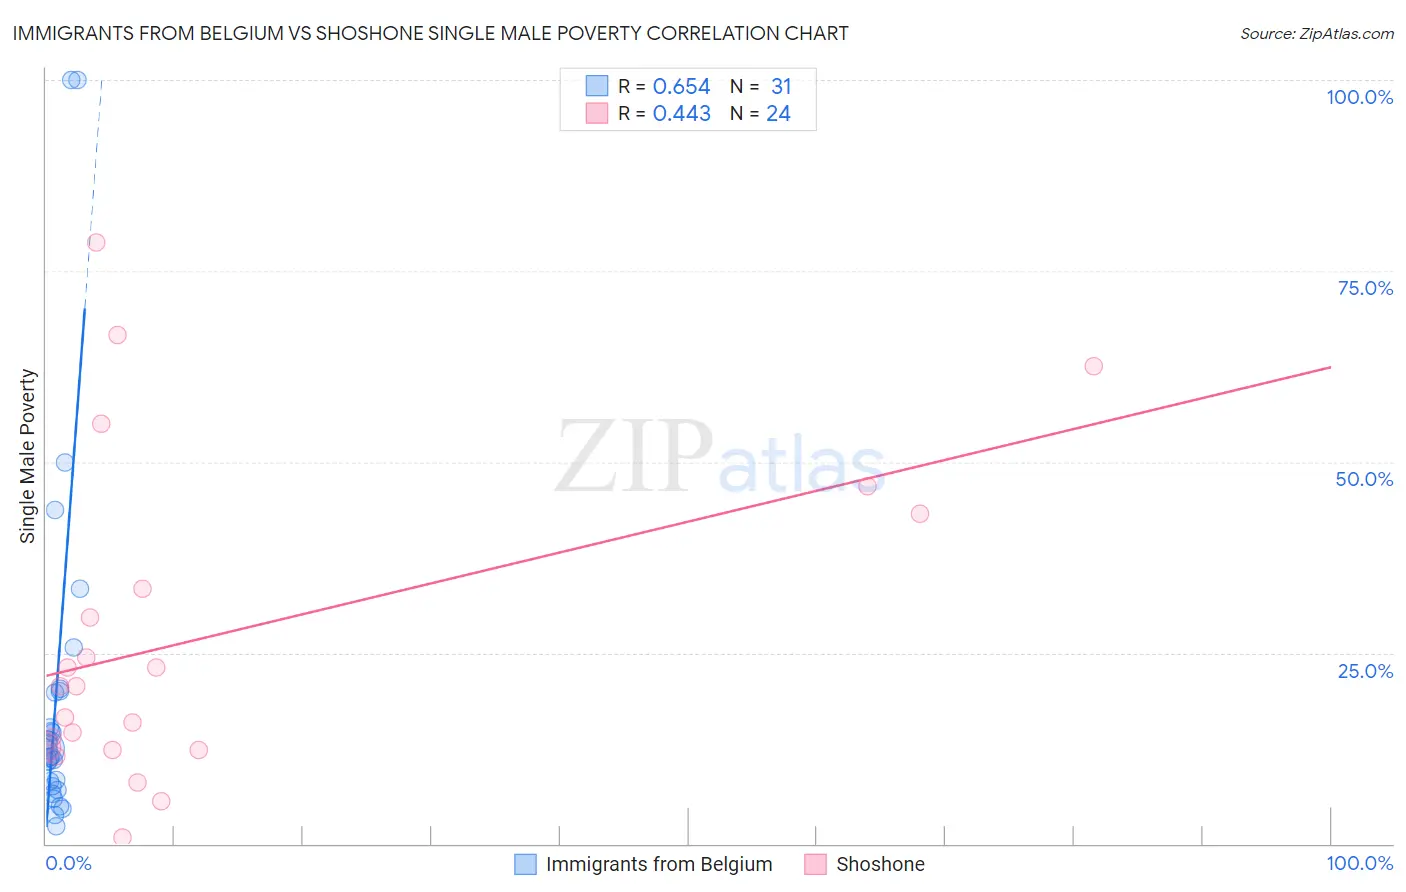
Immigrants from Belgium vs Shoshone Single Male Poverty Correlation Chart
The statistical analysis conducted on geographies consisting of 135,973,123 people shows a significant positive correlation between the proportion of Immigrants from Belgium and poverty level among single males in the United States with a correlation coefficient (R) of 0.654 and weighted average of 12.0%. Similarly, the statistical analysis conducted on geographies consisting of 64,727,315 people shows a moderate positive correlation between the proportion of Shoshone and poverty level among single males in the United States with a correlation coefficient (R) of 0.443 and weighted average of 16.7%, a difference of 38.7%.
Single Male Poverty Correlation Summary
| Measurement | Immigrants from Belgium | Shoshone |
| Minimum | 2.4% | 0.78% |
| Maximum | 100.0% | 78.7% |
| Range | 97.6% | 77.9% |
| Mean | 20.1% | 27.1% |
| Median | 12.3% | 20.6% |
| Interquartile 25% (IQ1) | 7.5% | 12.4% |
| Interquartile 75% (IQ3) | 20.0% | 38.3% |
| Interquartile Range (IQR) | 12.5% | 25.9% |
| Standard Deviation (Sample) | 23.9% | 20.9% |
| Standard Deviation (Population) | 23.5% | 20.5% |
Similar Demographics by Single Male Poverty
Demographics Similar to Immigrants from Belgium by Single Male Poverty
In terms of single male poverty, the demographic groups most similar to Immigrants from Belgium are Immigrants from Venezuela (12.0%, a difference of 0.10%), Immigrants from Malaysia (12.0%, a difference of 0.36%), Armenian (12.1%, a difference of 0.44%), Immigrants from South America (12.1%, a difference of 0.46%), and Immigrants from Colombia (12.1%, a difference of 0.52%).
| Demographics | Rating | Rank | Single Male Poverty |
| Immigrants | Argentina | 99.5 /100 | #72 | Exceptional 11.9% |
| Argentineans | 99.5 /100 | #73 | Exceptional 11.9% |
| Chileans | 99.5 /100 | #74 | Exceptional 11.9% |
| Uruguayans | 99.4 /100 | #75 | Exceptional 11.9% |
| Immigrants | Northern Africa | 99.4 /100 | #76 | Exceptional 11.9% |
| Immigrants | Malaysia | 99.2 /100 | #77 | Exceptional 12.0% |
| Immigrants | Venezuela | 99.1 /100 | #78 | Exceptional 12.0% |
| Immigrants | Belgium | 99.0 /100 | #79 | Exceptional 12.0% |
| Armenians | 98.7 /100 | #80 | Exceptional 12.1% |
| Immigrants | South America | 98.7 /100 | #81 | Exceptional 12.1% |
| Immigrants | Colombia | 98.6 /100 | #82 | Exceptional 12.1% |
| Immigrants | Chile | 98.6 /100 | #83 | Exceptional 12.1% |
| Immigrants | Czechoslovakia | 98.6 /100 | #84 | Exceptional 12.1% |
| Turks | 98.5 /100 | #85 | Exceptional 12.1% |
| Immigrants | Israel | 98.5 /100 | #86 | Exceptional 12.1% |
Demographics Similar to Shoshone by Single Male Poverty
In terms of single male poverty, the demographic groups most similar to Shoshone are Creek (16.8%, a difference of 1.0%), Immigrants from Yemen (16.9%, a difference of 1.1%), Osage (16.5%, a difference of 1.3%), Marshallese (16.4%, a difference of 1.4%), and Chippewa (16.4%, a difference of 1.9%).
| Demographics | Rating | Rank | Single Male Poverty |
| Cheyenne | 0.0 /100 | #315 | Tragic 16.1% |
| Dutch West Indians | 0.0 /100 | #316 | Tragic 16.1% |
| Blacks/African Americans | 0.0 /100 | #317 | Tragic 16.2% |
| Chickasaw | 0.0 /100 | #318 | Tragic 16.3% |
| Chippewa | 0.0 /100 | #319 | Tragic 16.4% |
| Marshallese | 0.0 /100 | #320 | Tragic 16.4% |
| Osage | 0.0 /100 | #321 | Tragic 16.5% |
| Shoshone | 0.0 /100 | #322 | Tragic 16.7% |
| Creek | 0.0 /100 | #323 | Tragic 16.8% |
| Immigrants | Yemen | 0.0 /100 | #324 | Tragic 16.9% |
| Choctaw | 0.0 /100 | #325 | Tragic 17.0% |
| Central American Indians | 0.0 /100 | #326 | Tragic 17.2% |
| Menominee | 0.0 /100 | #327 | Tragic 17.7% |
| Kiowa | 0.0 /100 | #328 | Tragic 18.3% |
| Colville | 0.0 /100 | #329 | Tragic 18.4% |