Bolivian vs Inupiat Single Male Poverty
COMPARE
Bolivian
Inupiat
Single Male Poverty
Single Male Poverty Comparison
Bolivians
Inupiat
11.2%
SINGLE MALE POVERTY
100.0/ 100
METRIC RATING
23rd/ 347
METRIC RANK
20.0%
SINGLE MALE POVERTY
0.0/ 100
METRIC RATING
333rd/ 347
METRIC RANK
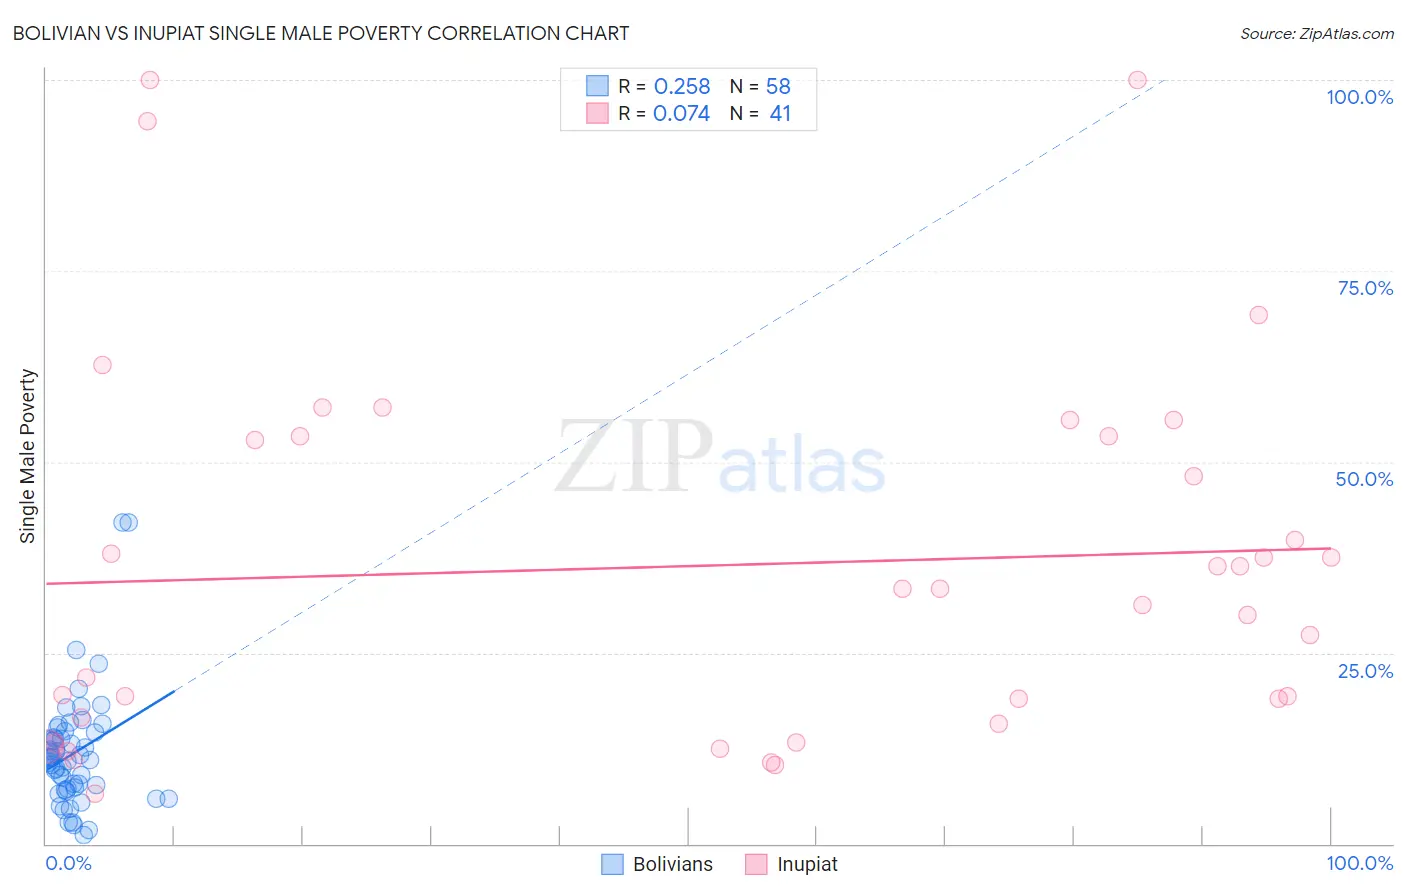
Bolivian vs Inupiat Single Male Poverty Correlation Chart
The statistical analysis conducted on geographies consisting of 171,550,226 people shows a weak positive correlation between the proportion of Bolivians and poverty level among single males in the United States with a correlation coefficient (R) of 0.258 and weighted average of 11.2%. Similarly, the statistical analysis conducted on geographies consisting of 93,554,052 people shows a slight positive correlation between the proportion of Inupiat and poverty level among single males in the United States with a correlation coefficient (R) of 0.074 and weighted average of 20.0%, a difference of 77.9%.
Single Male Poverty Correlation Summary
| Measurement | Bolivian | Inupiat |
| Minimum | 1.1% | 6.5% |
| Maximum | 42.1% | 100.0% |
| Range | 41.0% | 93.5% |
| Mean | 11.9% | 36.4% |
| Median | 11.1% | 33.3% |
| Interquartile 25% (IQ1) | 7.2% | 16.1% |
| Interquartile 75% (IQ3) | 14.5% | 53.3% |
| Interquartile Range (IQR) | 7.3% | 37.2% |
| Standard Deviation (Sample) | 7.7% | 24.6% |
| Standard Deviation (Population) | 7.6% | 24.3% |
Similar Demographics by Single Male Poverty
Demographics Similar to Bolivians by Single Male Poverty
In terms of single male poverty, the demographic groups most similar to Bolivians are Indian (Asian) (11.3%, a difference of 0.20%), Immigrants from Pakistan (11.2%, a difference of 0.21%), Maltese (11.3%, a difference of 0.22%), Asian (11.2%, a difference of 0.30%), and Immigrants from Japan (11.3%, a difference of 0.55%).
| Demographics | Rating | Rank | Single Male Poverty |
| Bhutanese | 100.0 /100 | #16 | Exceptional 11.1% |
| Tsimshian | 100.0 /100 | #17 | Exceptional 11.1% |
| Immigrants | Bolivia | 100.0 /100 | #18 | Exceptional 11.1% |
| Immigrants | Moldova | 100.0 /100 | #19 | Exceptional 11.2% |
| Ethiopians | 100.0 /100 | #20 | Exceptional 11.2% |
| Asians | 100.0 /100 | #21 | Exceptional 11.2% |
| Immigrants | Pakistan | 100.0 /100 | #22 | Exceptional 11.2% |
| Bolivians | 100.0 /100 | #23 | Exceptional 11.2% |
| Indians (Asian) | 100.0 /100 | #24 | Exceptional 11.3% |
| Maltese | 100.0 /100 | #25 | Exceptional 11.3% |
| Immigrants | Japan | 100.0 /100 | #26 | Exceptional 11.3% |
| Immigrants | China | 100.0 /100 | #27 | Exceptional 11.4% |
| Immigrants | Asia | 100.0 /100 | #28 | Exceptional 11.4% |
| Immigrants | Egypt | 100.0 /100 | #29 | Exceptional 11.4% |
| Iranians | 100.0 /100 | #30 | Exceptional 11.4% |
Demographics Similar to Inupiat by Single Male Poverty
In terms of single male poverty, the demographic groups most similar to Inupiat are Pima (20.2%, a difference of 0.80%), Native/Alaskan (19.6%, a difference of 1.9%), Paiute (19.3%, a difference of 3.6%), Cajun (19.1%, a difference of 4.8%), and Yuman (21.3%, a difference of 6.6%).
| Demographics | Rating | Rank | Single Male Poverty |
| Central American Indians | 0.0 /100 | #326 | Tragic 17.2% |
| Menominee | 0.0 /100 | #327 | Tragic 17.7% |
| Kiowa | 0.0 /100 | #328 | Tragic 18.3% |
| Colville | 0.0 /100 | #329 | Tragic 18.4% |
| Cajuns | 0.0 /100 | #330 | Tragic 19.1% |
| Paiute | 0.0 /100 | #331 | Tragic 19.3% |
| Natives/Alaskans | 0.0 /100 | #332 | Tragic 19.6% |
| Inupiat | 0.0 /100 | #333 | Tragic 20.0% |
| Pima | 0.0 /100 | #334 | Tragic 20.2% |
| Yuman | 0.0 /100 | #335 | Tragic 21.3% |
| Tohono O'odham | 0.0 /100 | #336 | Tragic 21.6% |
| Apache | 0.0 /100 | #337 | Tragic 21.6% |
| Pueblo | 0.0 /100 | #338 | Tragic 21.6% |
| Arapaho | 0.0 /100 | #339 | Tragic 21.9% |
| Sioux | 0.0 /100 | #340 | Tragic 22.2% |