Alaskan Athabascan vs Inupiat Single Male Poverty
COMPARE
Alaskan Athabascan
Inupiat
Single Male Poverty
Single Male Poverty Comparison
Alaskan Athabascans
Inupiat
16.1%
SINGLE MALE POVERTY
0.0/ 100
METRIC RATING
314th/ 347
METRIC RANK
20.0%
SINGLE MALE POVERTY
0.0/ 100
METRIC RATING
333rd/ 347
METRIC RANK
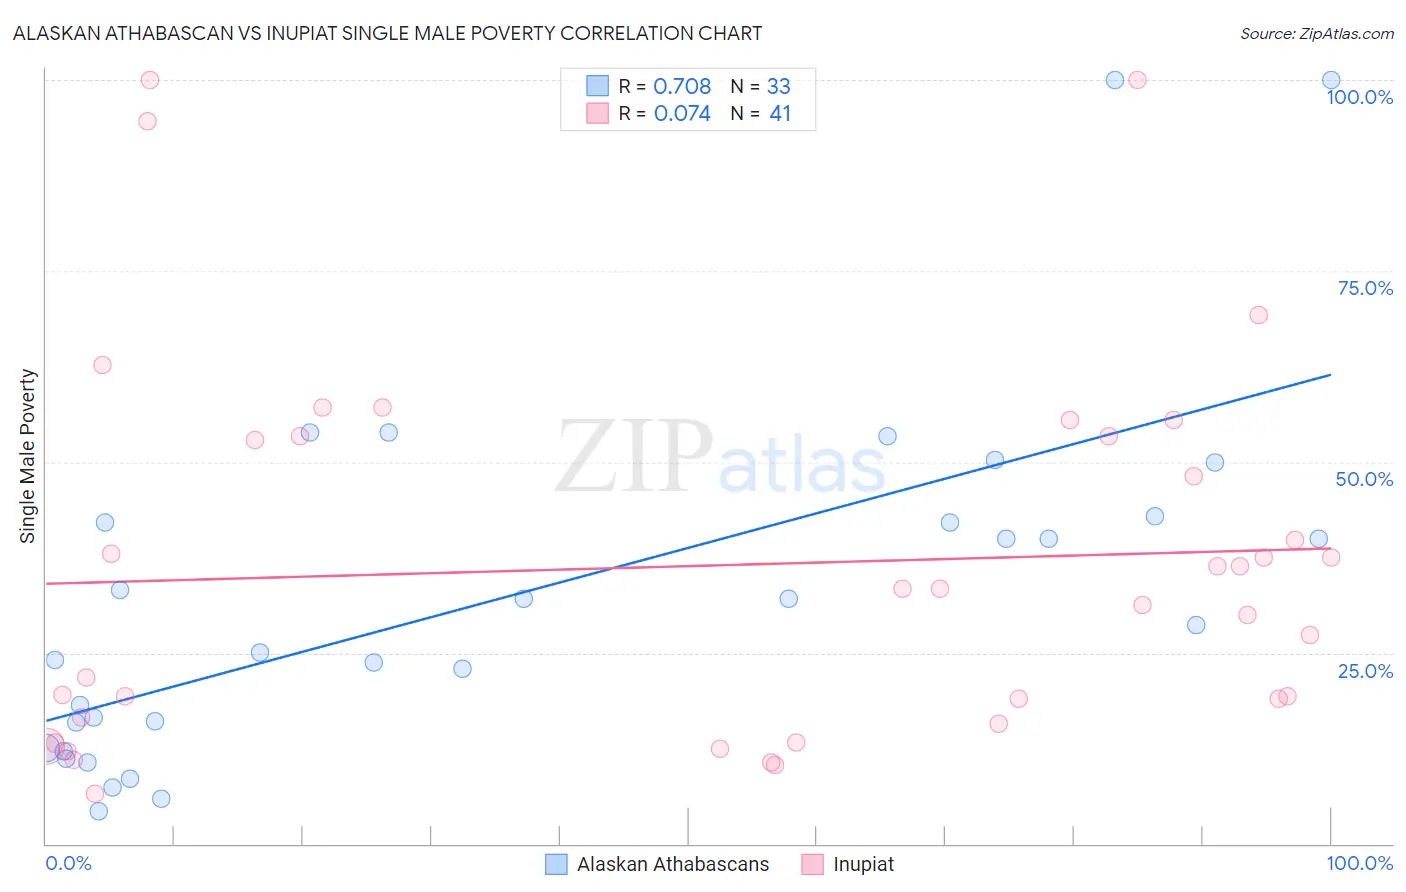
Alaskan Athabascan vs Inupiat Single Male Poverty Correlation Chart
The statistical analysis conducted on geographies consisting of 44,419,805 people shows a strong positive correlation between the proportion of Alaskan Athabascans and poverty level among single males in the United States with a correlation coefficient (R) of 0.708 and weighted average of 16.1%. Similarly, the statistical analysis conducted on geographies consisting of 93,554,052 people shows a slight positive correlation between the proportion of Inupiat and poverty level among single males in the United States with a correlation coefficient (R) of 0.074 and weighted average of 20.0%, a difference of 24.1%.
Single Male Poverty Correlation Summary
| Measurement | Alaskan Athabascan | Inupiat |
| Minimum | 4.3% | 6.5% |
| Maximum | 100.0% | 100.0% |
| Range | 95.7% | 93.5% |
| Mean | 32.4% | 36.4% |
| Median | 28.6% | 33.3% |
| Interquartile 25% (IQ1) | 14.2% | 16.1% |
| Interquartile 75% (IQ3) | 42.5% | 53.3% |
| Interquartile Range (IQR) | 28.2% | 37.2% |
| Standard Deviation (Sample) | 23.3% | 24.6% |
| Standard Deviation (Population) | 22.9% | 24.3% |
Demographics Similar to Alaskan Athabascans and Inupiat by Single Male Poverty
In terms of single male poverty, the demographic groups most similar to Alaskan Athabascans are Cheyenne (16.1%, a difference of 0.040%), Dutch West Indian (16.1%, a difference of 0.19%), Cherokee (16.1%, a difference of 0.29%), Black/African American (16.2%, a difference of 0.53%), and Chickasaw (16.3%, a difference of 1.3%). Similarly, the demographic groups most similar to Inupiat are Native/Alaskan (19.6%, a difference of 1.9%), Paiute (19.3%, a difference of 3.6%), Cajun (19.1%, a difference of 4.8%), Colville (18.4%, a difference of 8.4%), and Kiowa (18.3%, a difference of 9.2%).
| Demographics | Rating | Rank | Single Male Poverty |
| Cherokee | 0.0 /100 | #313 | Tragic 16.1% |
| Alaskan Athabascans | 0.0 /100 | #314 | Tragic 16.1% |
| Cheyenne | 0.0 /100 | #315 | Tragic 16.1% |
| Dutch West Indians | 0.0 /100 | #316 | Tragic 16.1% |
| Blacks/African Americans | 0.0 /100 | #317 | Tragic 16.2% |
| Chickasaw | 0.0 /100 | #318 | Tragic 16.3% |
| Chippewa | 0.0 /100 | #319 | Tragic 16.4% |
| Marshallese | 0.0 /100 | #320 | Tragic 16.4% |
| Osage | 0.0 /100 | #321 | Tragic 16.5% |
| Shoshone | 0.0 /100 | #322 | Tragic 16.7% |
| Creek | 0.0 /100 | #323 | Tragic 16.8% |
| Immigrants | Yemen | 0.0 /100 | #324 | Tragic 16.9% |
| Choctaw | 0.0 /100 | #325 | Tragic 17.0% |
| Central American Indians | 0.0 /100 | #326 | Tragic 17.2% |
| Menominee | 0.0 /100 | #327 | Tragic 17.7% |
| Kiowa | 0.0 /100 | #328 | Tragic 18.3% |
| Colville | 0.0 /100 | #329 | Tragic 18.4% |
| Cajuns | 0.0 /100 | #330 | Tragic 19.1% |
| Paiute | 0.0 /100 | #331 | Tragic 19.3% |
| Natives/Alaskans | 0.0 /100 | #332 | Tragic 19.6% |
| Inupiat | 0.0 /100 | #333 | Tragic 20.0% |